bicycleparameters Package
main Module
- class Bicycle(bicycleName, pathToData='.', forceRawCalc=False, forcePeriodCalc=False)
Bases:
objectAn object for a bicycle. A bicycle has parameters and can have a rider attached to it. That’s about it for now.
- add_rider(riderName, reCalc=False, draw=False)
Adds the inertial effects of a rigid rider to the bicycle.
- Parameters:
- riderNamestring
A rider name that corresponds to a folder in <pathToData>/riders/.
- reCalcboolean, optional
If true, the rider parameters will be recalculated.
- drawboolean, optional
If true, visual python will be used to draw a three dimensional image of the rider.
- calculate_from_measured(forcePeriodCalc=False)
Calculates the parameters from measured data.
- canonical(nominal=False)
Returns the canonical velocity and gravity independent matrices for the Whipple bicycle model linearized about the nominal configuration.
- Parameters:
- nominalboolean, optional
The default is false and uarrays are returned with the calculated uncertainties. If true ndarrays are returned without uncertainties.
- Returns:
- Muarray, shape(2,2)
Mass matrix.
- C1uarray, shape(2,2)
Velocity independent damping matrix.
- K0uarray, shape(2,2)
Gravity independent part of the stiffness matrix.
- K2uarray, shape(2,2)
Velocity squared independent part of the stiffness matrix.
Notes
The canonical matrices complete the following equation:
M * q’’ + v * C1 * q’ + [g * K0 + v**2 * K2] * q = f
where:
q = [phi, delta] f = [Tphi, Tdelta]
- phi
Bicycle roll angle.
- delta
Steer angle.
- Tphi
Roll torque.
- Tdelta
Steer torque.
- v
Bicylce speed.
If you have a flywheel defined, body D, it will completely be ignored in these results. These results are strictly for the Whipple bicycle model.
- compare_bode_speeds(speeds, u, y, fig=None)
Returns a figure with the Bode plots of multiple bicycles.
- Parameters:
- speedslist
A list of speeds at which to evaluate the system.
- uinteger
An integer between 0 and 1 corresponding to the inputs roll torque and steer torque.
- yinteger
An integer between 0 and 3 corresponding to the inputs roll angle, steer angle, roll rate, steer rate.
- Returns:
- figmatplotlib.Figure instance
The Bode plot.
Notes
The phases are matched around zero degrees at with respect to the first frequency.
- eig(speeds)
Returns the eigenvalues and eigenvectors of the Whipple bicycle model linearized about the nominal configuration.
- Parameters:
- speedsndarray, shape (n,) or float
The speed at which to calculate the eigenvalues.
- Returns:
- evalsndarray, shape (n, 4)
eigenvalues
- evecsndarray, shape (n, 4, 4)
eigenvectors
Notes
If you have a flywheel defined, body D, it will completely be ignored in these results. These results are strictly for the Whipple bicycle model.
- plot_bicycle_geometry(show=True, pendulum=True, centerOfMass=True, inertiaEllipse=True)
Returns a figure showing the basic bicycle geometry, the centers of mass and the moments of inertia.
- Parameters:
- showboolean, optional
If true
matplotlib.pyplot.show()will be called before exiting the function.- pendulumboolean, optional
If true the axes of the torsional pendulum will be displayed (only useful if raw measurement data is availabe).
- centerOfMassboolean, optional
If true the mass center of each rigid body will be displayed.
- inertiaEllipseboolean optional
If true inertia ellipses for each rigid body will be displayed.
- Returns:
- figmatplotlib.pyplot.Figure
Notes
If the flywheel is defined, it’s center of mass corresponds to the front wheel and is not depicted in the plot.
- plot_bode(speed, u, y, **kwargs)
Returns a Bode plot.
- Parameters:
- speedfloat
The speed at which to evaluate the system.
- uinteger
An integer between 0 and 1 corresponding to the inputs roll torque and steer torque.
- yinteger
An integer between 0 and 3 corresponding to the inputs roll angle steer angle, roll rate, steer rate.
- kwargskeyword pairs
Any options that can be passed to dtk.bode.
- Returns:
- magndarray, shape(1000,)
The magnitude in dB of the frequency reponse.
- phasendarray, shape(1000,)
The phase in degress of the frequency response.
- figmatplotlib figure
The Bode plot.
- plot_eigenvalues_vs_speed(speeds, fig=None, generic=False, color='black', show=False, largest=False, linestyle='-', grid=False, show_legend=True)
Returns a plot of the eigenvalues versus speed for the current benchmark parameters.
- Parameters:
- speedsndarray, shape(n,)
An array of speeds to calculate the eigenvalues at.
- figmatplotlib figure, optional
A figure to plot to.
- genericboolean
If true the lines will all be the same color and the modes will not be labeled.
- colormatplotlib color
If generic is true this will be the color of the plot lines.
- largestboolean
If true, only the largest eigenvalue is plotted.
- gridboolean, optional
If true, displays a grid on the plot.
- show_legend: boolean, optional
If true, displays a legend describing the different parts of the solution shown.
- Returns:
- figmatpolib.pyplot.Figure
The figure.
Notes
If you have a flywheel defined, body D, it will completely be ignored in these results. These results are strictly for the Whipple bicycle model.
- save_parameters(filetype='text')
Saves all the parameter sets to file.
- Parameters:
- filetypestring, optional
‘text’ : a text file with parameters as
c = 0.10+/-0.01‘matlab’ : matlab .mat file
‘pickle’ : python pickled dictionary
- show_pendulum_photos()
Opens up the pendulum photos in eye of gnome for inspection.
This only works in Linux and if eog is installed. Maybe check pythons xdg-mime model for having this work cross platform.
- state_space(speed, nominal=False)
Returns the A and B matrices for the Whipple model linearized about the upright constant velocity configuration.
- Parameters:
- speedfloat
The speed of the bicycle.
- nominalboolean, optional
The default is false and uarrays are returned with the calculated uncertainties. If true ndarrays are returned without uncertainties.
- Returns:
- Andarray, shape(4,4)
The state matrix.
- Bndarray, shape(4,2)
The input matrix.
Notes
AandBdescribe the Whipple model in state space form:x’ = A * x + B * u
where
- The states are [roll angle,
steer angle, roll rate, steer rate]
- The inputs are [roll torque,
steer torque]
If you have a flywheel defined, body D, it will completely be ignored in these results. These results are strictly for the Whipple bicycle model.
- steer_assembly_moment_of_inertia(handlebar=True, fork=True, wheel=True, aboutSteerAxis=False, nominal=False)
Returns the inertia tensor of the steer assembly with respect to a reference frame aligned with the steer axis.
- Parameters:
- handlebarboolean, optional
If true the handlebar will be included in the calculation.
- forkboolean, optional
If true the fork will be included in the calculation.
- wheelboolean, optional
If true then the wheel will be included in the calculation.
- aboutSteerAxisboolean, optional
If true the inertia tensor will be with respect to a point made from the projection of the center of mass onto the steer axis.
- nominalboolean, optional
If true the nominal values will be returned instead of a uarray.
- Returns:
- iAssfloat
Inertia tensor of the specified steer assembly parts with respect to a reference frame aligned with the steer axis.
Notes
The 3 component is aligned with the steer axis (pointing downward), the 1 component is perpendicular to the steer axis (pointing forward) and the 2 component is perpendicular to the steer axis (pointing to the right).
This function does not currently take into account the flywheel, D, if it is defined, beware.
- calculate_benchmark_from_measured(mp)
Returns the benchmark (Meijaard 2007) parameter set based on the measured data.
- Parameters:
- mpdictionary
Complete set of measured data.
- Returns:
- pardictionary
Benchmark bicycle parameter set.
- get_parts_in_parameters(par)
Returns a list of parts in a parameter dictionary.
- Parameters:
- pardictionary
Benchmark bicycle parameters.
- Returns:
- partslist
Unique list of parts that contain one or more of ‘H’, ‘B’, ‘F’, ‘R’, ‘S’, ‘G’, ‘D’.
- is_fork_split(mp)
Returns true if the fork was split into two parts and false if not.
- Parameters:
- mpdictionary
The measured data.
- Returns:
- forkIsSplitboolean
com Module
- cartesian(arrays, out=None)
Generate a cartesian product of input arrays.
- Parameters:
- arrayslist of array-like
1-D arrays to form the cartesian product of.
- outndarray
Array to place the cartesian product in.
- Returns:
- outndarray
2-D array of shape (M, len(arrays)) containing cartesian products formed of input arrays.
Examples
>>> cartesian(([1, 2, 3], [4, 5], [6, 7]))
array([[1, 4, 6],
       [1, 4, 7],
       [1, 5, 6],
       [1, 5, 7],
       [2, 4, 6],
       [2, 4, 7],
       [2, 5, 6],
       [2, 5, 7],
       [3, 4, 6],
       [3, 4, 7],
       [3, 5, 6],
       [3, 5, 7]])
- center_of_mass(slopes, intercepts)
Returns the center of mass relative to the slopes and intercepts coordinate system.
- Parameters:
- slopesndarray, shape(n,)
The slope of every line used to calculate the center of mass.
- interceptsndarray, shape(n,)
The intercept of every line used to calculate the center of mass.
- Returns:
- xfloat
The abscissa of the center of mass.
- yfloat
The ordinate of the center of mass.
- com_line(alpha, a, par, part, l1, l2)
Returns the slope and intercept for the line that passes through the part’s center of mass with reference to the benchmark bicycle coordinate system.
- Parameters:
- alphafloat
The angle the head tube makes with the horizontal. When looking at the bicycle from the right side this is the angle between a vector point out upwards along the steer axis and the earth horizontal with the positve direction pointing from the left to the right. If the bike is in its normal configuration this would be 90 degrees plus the steer axis tilt (lambda).
- afloat
The distance from the pendulum axis to a reference point on the part, typically the wheel centers. This is positive if the point falls to the left of the axis and negative otherwise.
- pardictionary
Benchmark parameters. Must include lam, rR, rF, w
- partstring
The subscript denoting which part this refers to.
- l1, l2floats
The location of the handlebar reference point relative to the front wheel center when the fork is split. This is measured perpendicular to and along the steer axis, respectively.
- Returns:
- mfloat
The slope of the line in the benchmark coordinate system.
- bfloat
The z intercept in the benchmark coordinate system.
- part_com_lines(mp, par, forkIsSplit)
Returns the slopes and intercepts for all of the center of mass lines for each part.
- Parameters:
- mpdictionary
Dictionary with the measured parameters.
- Returns:
- slopesdictionary
Contains a list of slopes for each part.
- interceptsdictionary
Contains a list of intercepts for each part.
- The slopes and intercepts lists are in order with respect to each other and
- the keyword is either ‘B’, ‘H’, ‘G’ or ‘S’ for Frame, Handlebar/Fork,
- Handlerbar, and Fork respectively.
- total_com(coordinates, masses)
Returns the center of mass of a group of objects if the indivdual centers of mass and mass is provided.
- coordinatesarray_like, shape(3,n)
The rows are the x, y and z coordinates, respectively and the columns are for each object.
- massesarray_like, shape(3,)
An array of the masses of multiple objects, the order should correspond to the columns of coordinates.
- Returns:
- mTfloat
Total mass of the objects.
- cTndarray, shape(3,)
The x, y, and z coordinates of the total center of mass.
bicycle Module
- ab_matrix(M, C1, K0, K2, v, g)
Calculate the A and B matrices for the Whipple bicycle model linearized about the upright configuration.
- Parameters:
- Mndarray, shape(2,2)
The mass matrix.
- C1ndarray, shape(2,2)
The damping like matrix that is proportional to the speed, v.
- K0ndarray, shape(2,2)
The stiffness matrix proportional to gravity, g.
- K2ndarray, shape(2,2)
The stiffness matrix proportional to the speed squared, v**2.
- vfloat
Forward speed.
- gfloat
Acceleration due to gravity.
- Returns:
- Andarray, shape(4,4)
State matrix.
- Bndarray, shape(4,2)
Input matrix.
- The states are [roll angle,
steer angle, roll rate, steer rate]
- The inputs are [roll torque,
steer torque]
- benchmark_par_to_canonical(p)
Returns the canonical matrices of the Whipple bicycle model linearized about the upright constant velocity configuration. It uses the parameter definitions from Meijaard et al. 2007.
- Parameters:
- pdictionary
A dictionary of the benchmark bicycle parameters. Make sure your units are correct, best to ue the benchmark paper’s units!
- Returns:
- Mndarray, shape(2,2)
The mass matrix.
- C1ndarray, shape(2,2)
The damping like matrix that is proportional to the speed, v.
- K0ndarray, shape(2,2)
The stiffness matrix proportional to gravity, g.
- K2ndarray, shape(2,2)
The stiffness matrix proportional to the speed squared, v**2.
Notes
This function handles parameters with uncertanties.
- lambda_from_abc(rF, rR, a, b, c)
Returns the steer axis tilt, lamba, for the parameter set based on the offsets from the steer axis.
- Parameters:
- rFfloat or ufloat
Front wheel radius.
- rRfloat or ufloat
Rear wheel radius.
- afloat or ufloat
The rear wheel offset. The minimum distance from the steer axis to the center of the rear wheel.
- bfloat or ufloat
The front wheel offset. The minimum distance from the steer axis to the center of the front wheel.
- cfloat or ufloat
The steer axis distance. The distance along the steer axis between the intersection of the front and rear wheel offset lines.
- sort_eigenmodes(evals, evecs)
Sort eigenvalues and eigenvectors.
- Parameters:
- evalsndarray, shape (n, 4)
A sequence of n sets of eigenvalues.
- evecsndarray, shape (n, 4, 4)
A sequence of n sets of eigenvectors.
- Returns:
- evalsorgndarray, shape (n, 4)
A sequence of n sets of eigenvalues.
- evecsorgndarray, shape (n, 4, 4)
A sequence of n sets of eigenvectors.
- sort_modes(evals, evecs)
Sort eigenvalues and eigenvectors into weave, capsize, caster modes.
- Parameters:
- evalsndarray, shape (n, 4)
eigenvalues
- evecsndarray, shape (n, 4, 4)
eigenvectors
- Returns:
- weave[‘evals’]ndarray, shape (n, 2)
The eigen value pair associated with the weave mode.
- weave[‘evecs’]ndarray, shape (n, 4, 2)
The associated eigenvectors of the weave mode.
- capsize[‘evals’]ndarray, shape (n,)
The real eigenvalue associated with the capsize mode.
- capsize[‘evecs’]ndarray, shape(n, 4, 1)
The associated eigenvectors of the capsize mode.
- caster[‘evals’]ndarray, shape (n,)
The real eigenvalue associated with the caster mode.
- caster[‘evecs’]ndarray, shape(n, 4, 1)
The associated eigenvectors of the caster mode.
Notes
This only works on the standard bicycle eigenvalues, not necessarily on any general eigenvalues for the bike model (e.g. there isn’t always a distinct weave, capsize and caster). Some type of check using the derivative of the curves could make it more robust.
- trail(rF, lam, fo)
Calculate the trail and mechanical trail.
- Parameters:
- rFfloat
The front wheel radius
- lamfloat
The steer axis tilt (pi/2 - headtube angle). The angle between the headtube and a vertical line.
- fofloat
The fork offset
- Returns:
- c: float
Trail
- cm: float
Mechanical Trail
geometry Module
- calc_two_link_angles(L1, L2, D)
Solves a simple case of the two-link revolute joint inverse kinematics problem. Both output angles are positive. The simple case is that the end of the second link lies on the x-axis.
- Parameters:
- L1float
Length of the first link.
- L2float
Length of the second link.
- Dfloat
Distance from the base of first link to the end of the second link.
- Returns:
- theta1float
(radians) Angle between x-axis and first link; always positive.
- theta2float
(radians) Angle between first link and second link; always positive.
- calculate_abc_geometry(h, d)
Returns the perpendicular distance geometry for the bicycle from the raw measurements.
- Parameters:
- htuple
Tuple containing the measured parameters h1-h5. (h1, h2, h3, h4, h5)
- dtuple
Tuple containing the measured parameters d1-d4 and d. (d1, d2, d3, d4, d)
- Returns:
- aufloat or float
The rear frame offset.
- bufloat or float
The fork offset.
- cufloat or float
The steer axis distance.
- calculate_benchmark_geometry(mp, par)
Returns the wheelbase, steer axis tilt and the trail.
- Parameters:
- mpdictionary
Dictionary with the measured parameters.
- pardictionary
Dictionary with the benchmark parameters.
- Returns:
- pardictionary
par with the benchmark geometry added.
- calculate_l1_l2(h6, h7, d5, d6, l)
Returns the distance along (l2) and perpendicular (l1) to the steer axis from the front wheel center to the handlebar reference point.
- Parameters:
- h6float
Distance from the table to the top of the front axle.
- h7float
Distance from the table to the top of the handlebar reference circle.
- d5float
Diameter of the front axle.
- d6float
Diameter of the handlebar reference circle.
- lfloat
Outer distance from the front axle to the handlebar reference circle.
- Returns:
- l1float
The distance from the front wheel center to the handlebar reference center perpendicular to the steer axis. The positive sense is if the handlebar reference point is more forward than the front wheel center relative to the steer axis normal.
- l2float
The distance from the front wheel center to the handlebar reference center parallel to the steer axis. The positive sense is if the handlebar reference point is above the front wheel center with reference to the steer axis.
- distance_to_steer_axis(w, c, lam, point)
Returns the minimal distance from the steer axis to the given point when the bicycle is in the nominal configuration.
- Parameters:
- wfloat or ufloat
Wheelbase.
- cfloat or ufloat
Trail.
- lamfloat or ufloat
Steer axis tilt in radians.
- pointnarray, shape(3,)
A point that lies in the symmetry plane of the bicycle.
- Returns:
- dfloat or ufloat
The minimal distance from the given point to the steer axis.
- fundamental_geometry_plot_data(par)
Returns the coordinates for line end points of the bicycle fundamental geometry.
- Parameters:
- pardictionary
Benchmark bicycle parameters.
- Returns:
- xndarray
- zndarray
- fwheel_to_handlebar_ref(lam, l1, l2)
Returns the distance along the benchmark coordinates from the front wheel center to the handlebar reference center.
- Parameters:
- lamfloat
Steer axis tilt.
- l1, l2float
The distance from the front wheel center to the handlebar refernce center perpendicular to and along the steer axis.
- Returns:
- u1, u2float
- point_to_line_distance(point, pointsOnLine)
Returns the minimal distance from a point to a line in three dimensional space.
- Parameters:
- pointndarray, shape(3,)
The x, y, and z coordinates of a point.
- pointsOnLinendarray, shape(3,2)
The x, y, and z coordinates of two points on a line. Rows are coordinates and columns are points.
- Returns:
- distancefloat
The minimal distance from the line to the point.
- project_point_on_line(line, point)
Returns point of projection.
- Parameters:
- linetuple
Slope and intercept of the line.
- pointtuple
Location of the point.
- Returns:
- newPointtuple
The location of the projected point.
- vec_angle(v1, v2)
Returns the interior angle between two vectors using the dot product. Inputs do not need to be unit vectors.
- Parameters:
- v1np.array (3,1)
input vector.
- v2np.array (3,1)
input vector.
- Returns:
- anglefloat
(radians) interior angle between v1 and v2.
- vec_project(vec, direction)
Vector projection into a plane, where the plane is defined by a normal vector.
- Parameters:
- vecnp.array(3,1)
vector to be projected into a plane
- directionint or np.array, shape(3,)
If int, it is one of the three orthogonal directions, (0,1 or 2) of the input vector (essentially, that component of vec is set to zero). If np.array, can be in any direction (not necessarily a coordinate direction).
- Returns:
- vec_outnp.array(3,1)
Projected vector.
inertia Module
- combine_bike_rider(bicyclePar, riderPar)
Combines the inertia of the bicycle frame with the inertia of a rider.
- Parameters:
- bicyclePardictionary
The benchmark parameter set of a bicycle.
- riderPardictionary
The rider’s mass, center of mass, and inertia expressed in the benchmark bicycle reference frame.
- Returns:
- bicyclePardictionary
The benchmark bicycle parameters with a rigid rider added to the bicycle frame.
- compound_pendulum_inertia(m, g, l, T)
Returns the moment of inertia for an object hung as a compound pendulum.
- Parameters:
- mfloat
Mass of the pendulum.
- gfloat
Acceration due to gravity.
- lfloat
Length of the pendulum.
- Tfloat
The period of oscillation.
- Returns:
- Ifloat
Moment of interia of the pendulum.
- inertia_components(jay, beta)
Returns the 2D orthogonal inertia tensor.
When at least three moments of inertia and their axes orientations are known relative to a common inertial frame of a planar object, the orthoganl moments of inertia relative the frame are computed.
- Parameters:
- jayndarray, shape(n,)
An array of at least three moments of inertia. (n >= 3)
- betandarray, shape(n,)
An array of orientation angles corresponding to the moments of inertia in jay.
- Returns:
- eyendarray, shape(3,)
Ixx, Ixz, Izz
- parallel_axis(Ic, m, d)
Returns the moment of inertia of a body about a different point.
- Parameters:
- Icndarray, shape(3,3)
The moment of inertia about the center of mass of the body with respect to an orthogonal coordinate system.
- mfloat
The mass of the body.
- dndarray, shape(3,)
The distances along the three ordinates that located the new point relative to the center of mass of the body.
- Returns:
- Indarray, shape(3,3)
The moment of inertia about of the body about a point located by d.
- part_inertia_tensor(par, part)
Returns an inertia tensor for a particular part for the benchmark parameter set.
- Parameters:
- pardictionary
Complete Benchmark parameter set.
- partstring
Either ‘B’, ‘H’, ‘F’, ‘R’, ‘G’, ‘S’, ‘D’
- Returns:
- Indarray, shape(3,3)
Inertia tensor for the part.
Notes
Parts G, S, and D are additional parts not included in the published paper on the benchmark bicycle, they are only relavant if used. See the documentation.
- principal_axes(I)
Returns the principal moments of inertia and the orientation.
- Parameters:
- Indarray, shape(3,3)
An inertia tensor.
- Returns:
- Ipndarray, shape(3,)
The principal moments of inertia. This is sorted smallest to largest.
- Cndarray, shape(3,3)
The rotation matrix.
- rotate_inertia_tensor(I, angle)
Returns inertia tensor rotated through angle. Only for 2D
- tor_inertia(k, T)
Calculate the moment of inertia for an ideal torsional pendulm
- Parameters:
- k: torsional stiffness
- T: period
- Returns:
- I: moment of inertia
- torsional_pendulum_stiffness(I, T)
Calculate the stiffness of a torsional pendulum with a known moment of inertia.
- Parameters:
- Imoment of inertia
- Tperiod
- Returns:
- kstiffness
- tube_inertia(l, m, ro, ri)
Calculate the moment of inertia for a tube (or rod) where the x axis is aligned with the tube’s axis.
- Parameters:
- lfloat
The length of the tube.
- mfloat
The mass of the tube.
- rofloat
The outer radius of the tube.
- rifloat
The inner radius of the tube. Set this to zero if it is a rod instead of a tube.
- Returns:
- Ixfloat
Moment of inertia about tube axis.
- Iy, Izfloat
Moment of inertia about normal axis.
io Module
- filename_to_dict(filename)
Returns a dictionay of values based on the pendulum data file name.
- load_parameter_text_file(pathToFile)
Returns a dictionary of float and/or ufloat parameters from a parameter file.
- Parameters:
- pathToFilestring
The path to the text file with the parameters listed in the specified format.
- Returns:
- parametersdictionary
A dictionary of the values stored in the text files.
- For example::
c = 0.08 +/- 0.01 d=0.314+/-0.002 t = 0.1+/-0.01, 0.12+/-0.02 whb = 0.5
- The first item on the line must be the variable name and the second is an
- equals sign. The values to the right of the equal sign much may or may not
- contain an uncertainty designated by +/-. Multiple comma seperated values
- will be averaged.
- load_pendulum_mat_file(pathToFile)
Returns a dictionay containing the data from the pendulum data mat file.
- remove_uncertainties(dictionary)
Returns a dictionary with the uncertainties removed.
- space_out_camel_case(s, output='string')
Adds spaces to a camel case string. Failure to space out string returns the original string.
Examples
>>> space_out_camel_case('DMLSServicesOtherBSTextLLC')
'DMLS Services Other BS Text LLC'
>>> space_out_camel_case('DMLSServicesOtherBSTextLLC', output='list')
['DMLS', 'Services', 'Other', 'BS', 'Text', 'LLC']
- write_parameter_text_file(pathToTxtFile, parDict)
Writes parameter set to file.
- Parameters:
- pathToTxtFilestring
The path to the file to write the parameters.
- pardictdictionary
A dictionary of parameters for the bicycle.
- Returns:
- savedboolean
True if the file was saved and false if not.
- write_periods_to_file(pathToRawFile, mp)
Writes the provided periods to file.
- Parameters:
- pathToRawFilestring
The path to the <bicycle name>Measured.txt file
- mpdictionary
The measured parameters dictionary. Should contain complete period data.
models Module
- class Meijaard2007Model(parameter_set)
Bases:
_ModelWhipple-Carvallo model presented in [Meijaard2007]. It is both linear and the minimal model in terms of states and coordinates that fully describe the vehicle’s dynamics: self-stability and non-minimum phase behavior.
- Parameters:
- parameter_setParameterSet
The
paramter_set.to_parameterization('meijaard2007')must return a dictionary that maps floats to the parameter keys containing:IBxx: x moment of inertia of the frame/rider [kg*m**2]IBxz: xz product of inertia of the frame/rider [kg*m**2]IBzz: z moment of inertia of the frame/rider [kg*m**2]IFxx: x moment of inertia of the front wheel [kg*m**2]IFyy: y moment of inertia of the front wheel [kg*m**2]IHxx: x moment of inertia of the handlebar/fork [kg*m**2]IHxz: xz product of inertia of the handlebar/fork [kg*m**2]IHzz: z moment of inertia of the handlebar/fork [kg*m**2]IRxx: x moment of inertia of the rear wheel [kg*m**2]IRyy: y moment of inertia of the rear wheel [kg*m**2]c: trail [m]g: acceleration due to gravity [m/s**2]lam: steer axis tilt [rad]mB: frame/rider mass [kg]mF: front wheel mass [kg]mH: handlebar/fork assembly mass [kg]mR: rear wheel mass [kg]rF: front wheel radius [m]rR: rear wheel radius [m]v: speed [m/s]w: wheelbase [m]xB: x distance to the frame/rider center of mass [m]xH: x distance to the frame/rider center of mass [m]zB: z distance to the frame/rider center of mass [m]zH: z distance to the frame/rider center of mass [m]
References
[Meijaard2007]Meijaard J.P, Papadopoulos Jim M, Ruina Andy and Schwab A.L, 2007, Linearized dynamics equations for the balance and steer of a bicycle: a benchmark and review, Proc. R. Soc. A., 463:1955–1982 http://doi.org/10.1098/rspa.2007.1857
- Attributes:
- input_varslist of strings
Ordered list of ASCII strings that name the model’s input variables.
- state_varslist of strings
Ordered list of ASCII strings that name the model’s state variables.
- input_vars_latexlist of raw strings
Ordered list of LaTeX strings that name the model’s input variables.
- state_vars_latexlist of raw strings
Ordered list of LaTeX strings that name the model’s state variables.
- calc_eigen(left=False, **parameter_overrides)
Returns the right (or left) eigenvalues and eigenvectors of the linear model.
- Parameters:
- leftboolean, optional
If true, the left eigenvectors will be returned, i.e.
A.T*v=lam*v.- **parameter_overridesdictionary
Parameter keys that map to floats or array_like of floats shape(n,). All keys that map to array_like must be of the same length.
- Returns:
- evalsndarray, shape(4,) or shape (n,4)
Eigenvalues.
- evecsndarray, shape(4,4) or shape (n,4,4)
Eigenvectors, each columns are eigenvectors and are associated with same index of the eigenvalues.
Examples
>>> from bicycleparameters.parameter_dicts import meijaard2007_browser_jason
>>> from bicycleparameters.parameter_sets import Meijaard2007ParameterSet
>>> from bicycleparameters.models import Meijaard2007Model
>>> p = Meijaard2007ParameterSet(meijaard2007_browser_jason, True)
>>> m = Meijaard2007Model(p)
>>> evals, evecs = m.calc_eigen()
>>> evals
array([-6.74423162+0.j        , -2.9146438 +0.j        ,
        3.39244999+0.61085077j,  3.39244999-0.61085077j])
>>> evecs
array([[ 0.00197344+0.j        , -0.2953538 +0.j        ,
         0.04320146-0.0753826j ,  0.04320146+0.0753826j ],
       [ 0.14665803+0.j        ,  0.13447333+0.j        ,
        -0.26053575+0.04691255j, -0.26053575-0.04691255j],
       [-0.01330934+0.j        ,  0.86085111+0.j        ,
         0.1926063 -0.22934205j,  0.1926063 +0.22934205j],
       [-0.98909574+0.j        , -0.39194186+0.j        ,
        -0.91251108+0.j        , -0.91251108-0.j        ]])
- form_reduced_canonical_matrices(**parameter_overrides)
Returns the canonical speed and gravity independent matrices for the Whipple-Carvallo bicycle model linearized about the nominal upright configuration.
- Parameters:
- **parameter_overridesdictionary
Parameter keys that map to floats or array_like of floats shape(n,). All keys that map to array_like must be of the same length.
- Returns:
- Mndarray, shape(2,2) or shape(n,2,2)
Mass matrix.
- C1ndarray, shape(2,2) or shape(n,2,2)
Velocity independent damping matrix.
- K0ndarray, shape(2,2) or shape(n,2,2)
Gravity independent part of the stiffness matrix.
- K2ndarray, shape(2,2) or shape(n,2,2)
Velocity squared independent part of the stiffness matrix.
Notes
The canonical matrices complete the following equation:
M*q'' + v*C1*q' + [g*K0 + v**2*K2]*q = fwhere:
q = [phi, delta]f = [Tphi, Tdelta]
phiBicycle roll angle.
deltaSteer angle.
TphiRoll torque.
TdeltaSteer torque.
vBicylce longitudinal speed.
gAcceleration due to gravity.
Examples
>>> from bicycleparameters.parameter_dicts import meijaard2007_browser_jason
>>> from bicycleparameters.parameter_sets import Meijaard2007ParameterSet
>>> from bicycleparameters.models import Meijaard2007Model
>>> p = Meijaard2007ParameterSet(meijaard2007_browser_jason, True)
>>> m = Meijaard2007Model(p)
>>> M, C1, K0, K2 = m.form_reduced_canonical_matrices()
>>> M
array([[102.78013216,   1.53582801],
       [  1.53582801,   0.24890226]])
>>> C1
array([[ 0.       , 26.3947333],
       [-0.4503006,  1.037066 ]])
>>> K0
array([[-89.32195981,  -1.74159477],
       [ -1.74159477,  -0.67769624]])
>>> K2
array([[ 0.        , 74.12543   ],
       [ 0.        ,  1.57021553]])
>>> M, _, _, _ = m.form_reduced_canonical_matrices(mB=150.0)
>>> M
array([[176.52178763,   2.69074048],
       [  2.69074048,   0.26699004]])
- form_state_space_matrices(**parameter_overrides)
Returns the A and B matrices for the Whipple-Carvallo model linearized about the upright constant velocity configuration.
- Parameters:
- **parameter_overridesdictionary
Parameter keys that map to floats or array_like of floats shape(n,). All keys that map to array_like must be of the same length.
- Returns:
- Andarray, shape(4,4) or shape(n,4,4)
The state matrix.
- Bndarray, shape(4,2) or shape(n,4,2)
The input matrix.
Notes
AandBdescribe the Whipple model in state space form:x' = A * x + B * uwhere the states are:
x = |roll angle | = |phi     |
    |steer angle|   |delta   |
    |roll rate  |   |phidot  |
    |steer rate |   |deltadot|
and the inputs are:
u = |roll torque | = |Tphi  |
    |steer torque|   |Tdelta|
Examples
>>> from bicycleparameters.parameter_dicts import meijaard2007_browser_jason
>>> from bicycleparameters.parameter_sets import Meijaard2007ParameterSet
>>> from bicycleparameters.models import Meijaard2007Model
>>> p = Meijaard2007ParameterSet(meijaard2007_browser_jason, True)
>>> m = Meijaard2007Model(p)
>>> A, B = m.form_state_space_matrices()
>>> A
array([[ 0.        ,  0.        ,  1.        ,  0.        ],
       [ 0.        ,  0.        ,  0.        ,  1.        ],
       [ 8.26150335, -0.9471634 , -0.02977958, -0.21430735],
       [17.66475151, 26.24590352,  1.99289841, -2.84419587]])
>>> B
array([[ 0.        ,  0.        ],
       [ 0.        ,  0.        ],
       [ 0.01071772, -0.06613267],
       [-0.06613267,  4.42570676]])
- input_vars = ['Tphi', 'Tdelta']
- input_vars_latex = ['T_\\phi', 'T_\\delta']
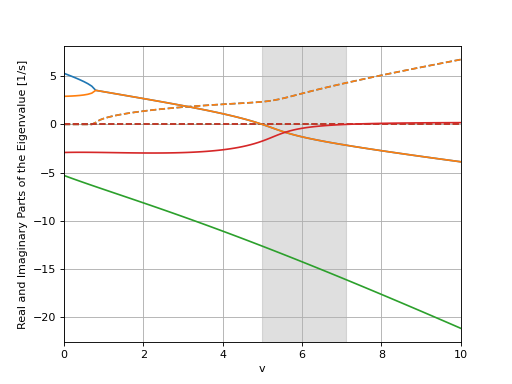
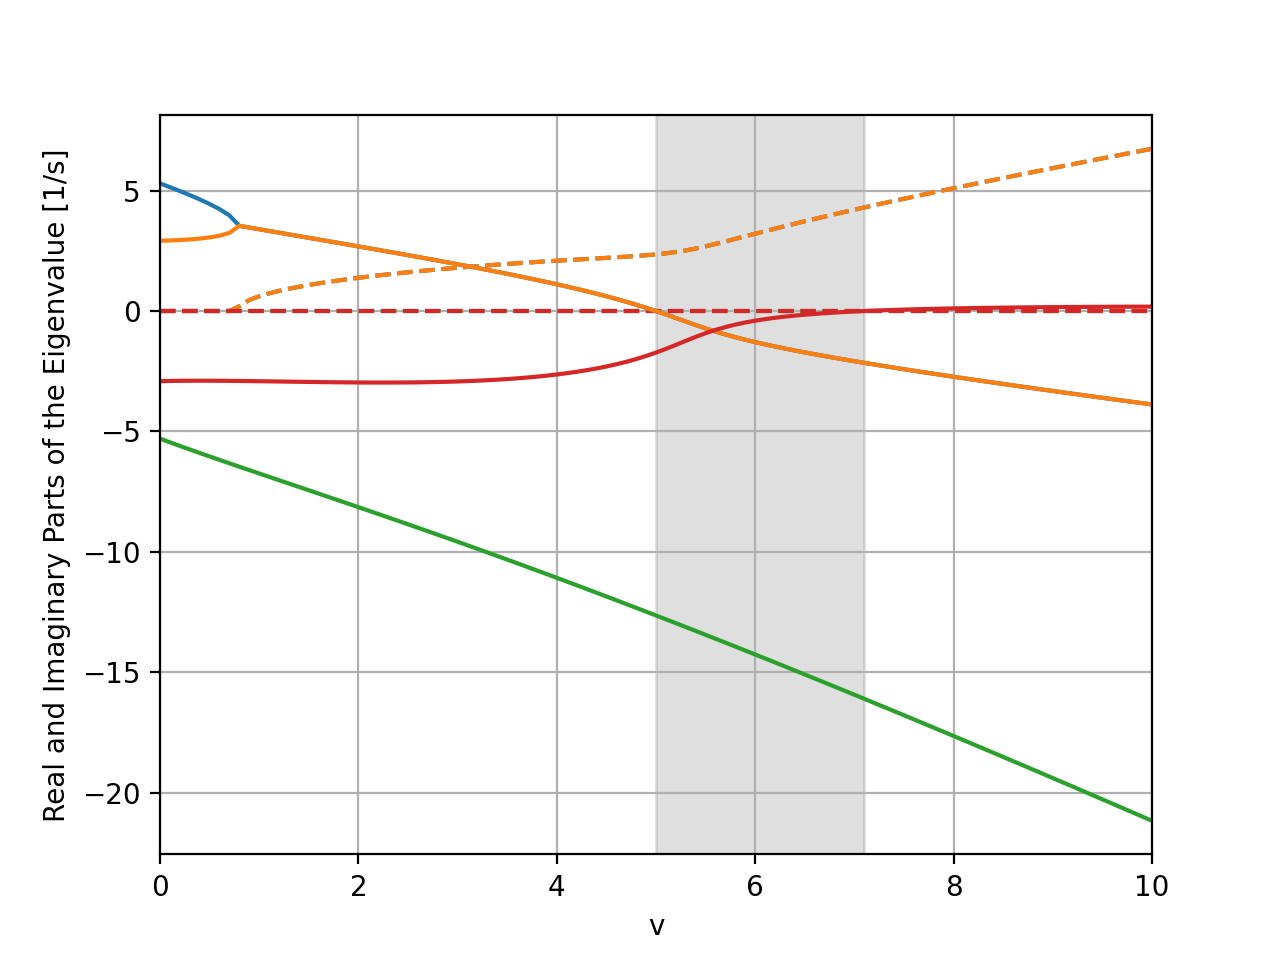
- plot_eigenvalue_parts(ax=None, colors=None, show_stable_regions=True, **parameter_overrides)
Returns a matplotlib axis of the real and imaginary parts of the eigenvalues plotted against the provided parameter.
- Parameters:
- axAxes
Matplotlib axes.
- colorssequence, len(4)
Matplotlib colors for the 4 modes.
- show_stable_regionsboolean, optional
If true, a grey shaded background will indicate stable regions.
- **parameter_overridesdictionary
Parameter keys that map to floats or array_like of floats shape(n,). All keys that map to array_like must be of the same length.
Examples
import numpy as np
from bicycleparameters.parameter_dicts import meijaard2007_browser_jason
from bicycleparameters.parameter_sets import Meijaard2007ParameterSet
from bicycleparameters.models import Meijaard2007Model
p = Meijaard2007ParameterSet(meijaard2007_browser_jason, True)
m = Meijaard2007Model(p)
m.plot_eigenvalue_parts(v=np.linspace(0.0, 10.0, num=101))
(
Source code,png,hires.png,pdf)
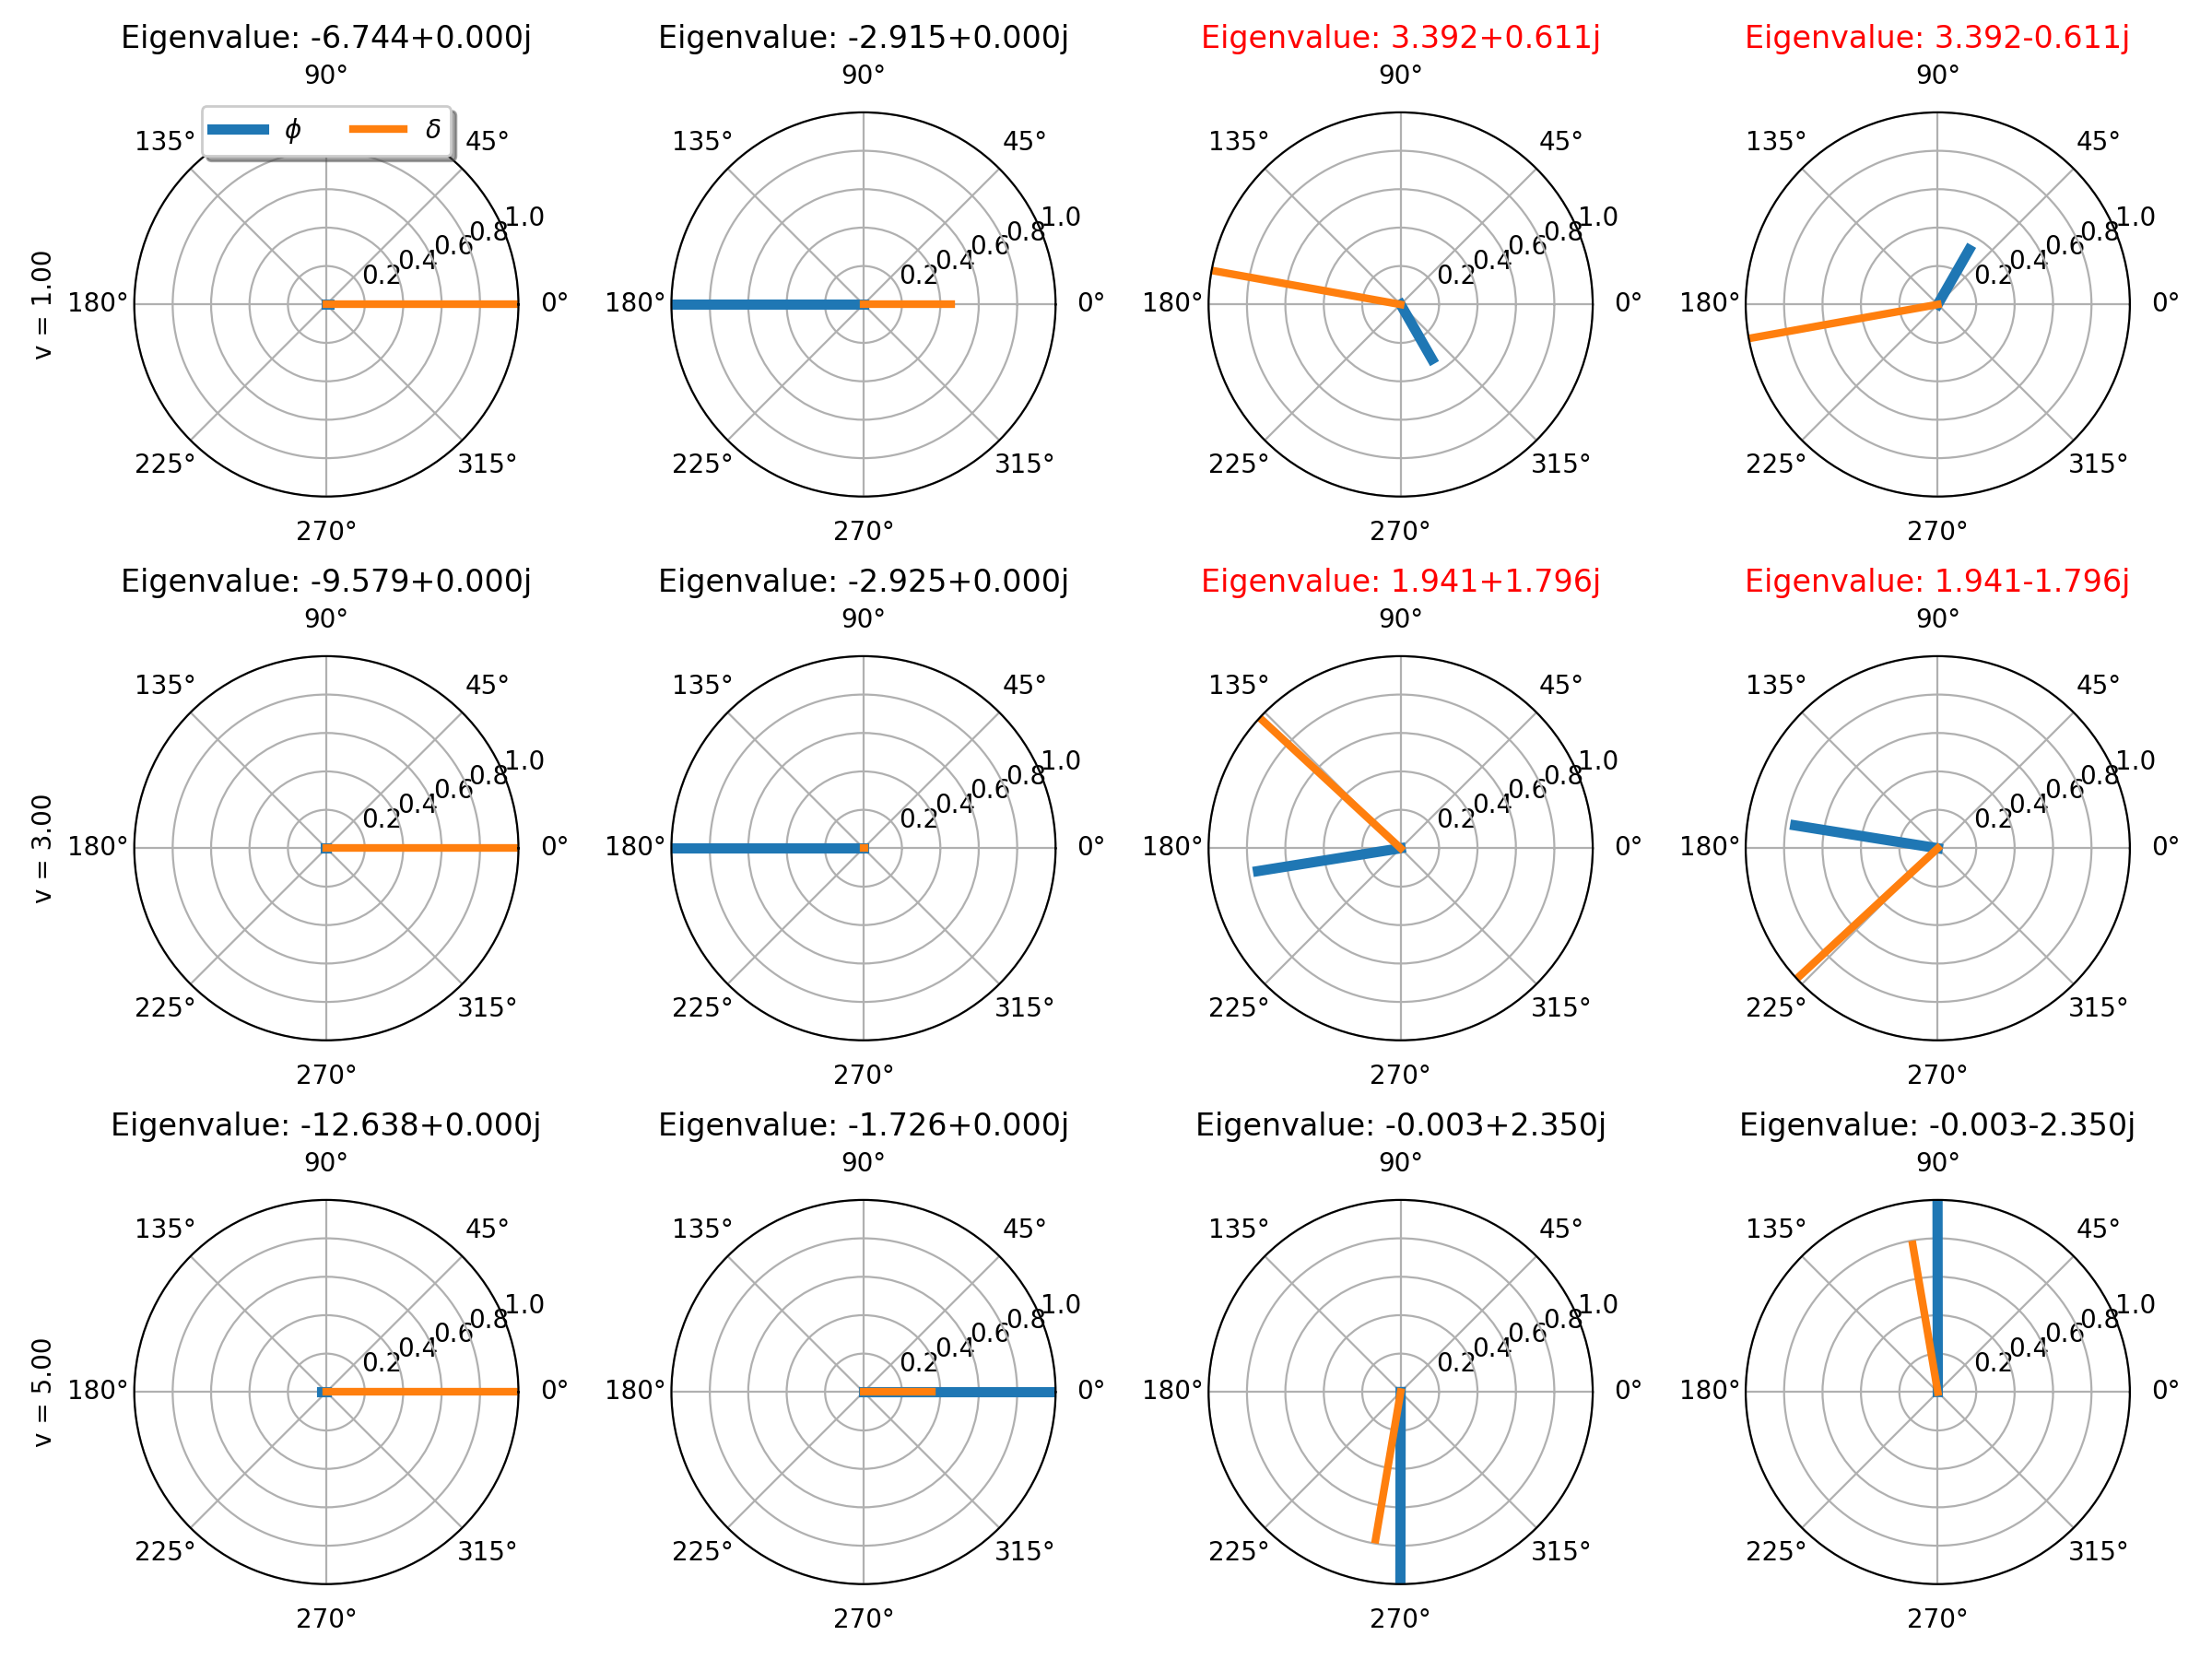
- plot_eigenvectors(**parameter_overrides)
Plots the components of the eigenvectors in the real and imaginary plane.
- Parameters:
- **parameter_overridesdictionary
Parameter keys that map to floats or array_like of floats shape(n,). All keys that map to array_like must be of the same length.
- Returns:
- axesndarray, shape(n, 4)
Polar plot axes for each eigenvector (columns). The rows correspond to a varied parameter.
Examples
import numpy as np
from bicycleparameters.parameter_dicts import meijaard2007_browser_jason
from bicycleparameters.parameter_sets import Meijaard2007ParameterSet
from bicycleparameters.models import Meijaard2007Model
p = Meijaard2007ParameterSet(meijaard2007_browser_jason, True)
m = Meijaard2007Model(p)
m.plot_eigenvectors(v=[1.0, 3.0, 5.0])
(
Source code,png,hires.png,pdf)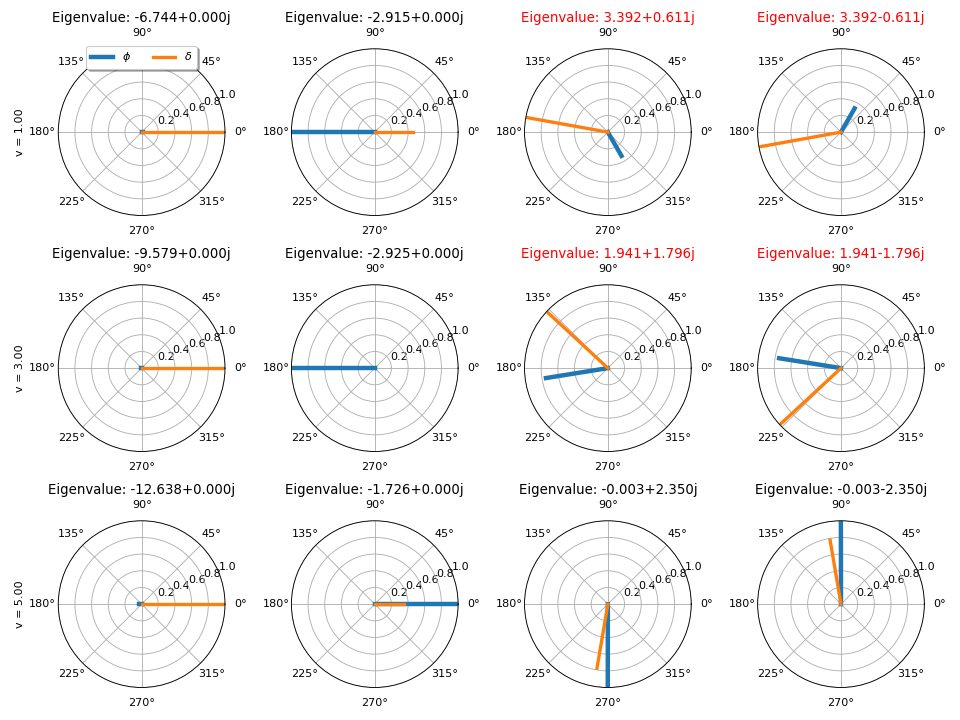
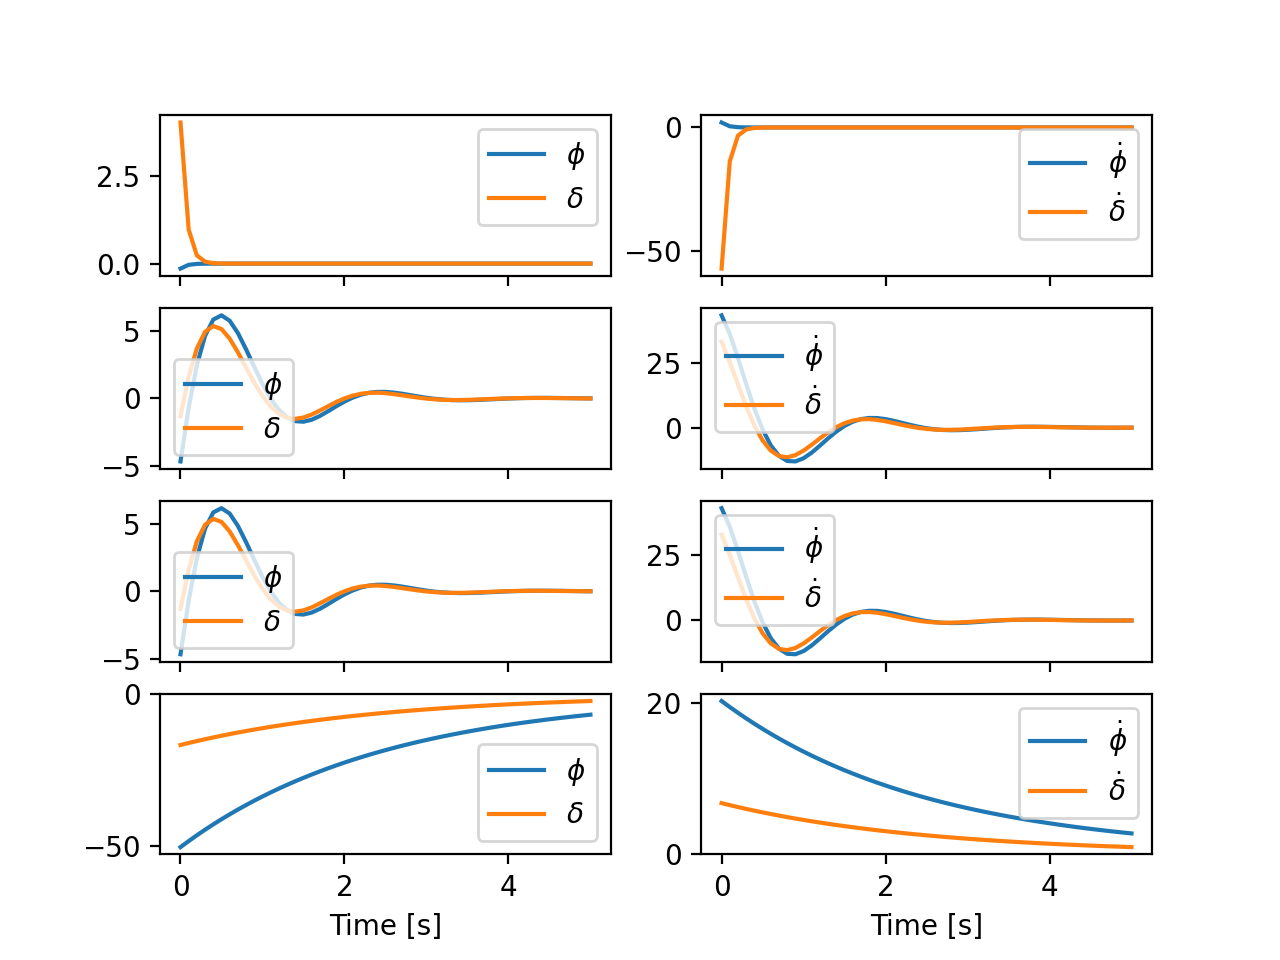
- plot_mode_simulations(times, **parameter_overrides)
Returns matplotlib subplot axes with a simulation of each mode.
- Parameters:
- timesarray_like, shape(n,)
Monotonic increasing time values to simulate over.
- **parameter_overridesdictionary
Parameter keys that map to floats or array_like of floats shape(n,). All keys that map to array_like must be of the same length.
- Returns:
- axesndarray, shape(4,2)
Subplot axes with the modes on the rows and the angles in the first column and the angular rates in the second column.
Examples
import numpy as np
from bicycleparameters.parameter_dicts import meijaard2007_browser_jason
from bicycleparameters.parameter_sets import Meijaard2007ParameterSet
from bicycleparameters.models import Meijaard2007Model
p = Meijaard2007ParameterSet(meijaard2007_browser_jason, True)
m = Meijaard2007Model(p)
times = np.linspace(0.0, 5.0, num=51)
m.plot_mode_simulations(times, v=6.0)
(
Source code,png,hires.png,pdf)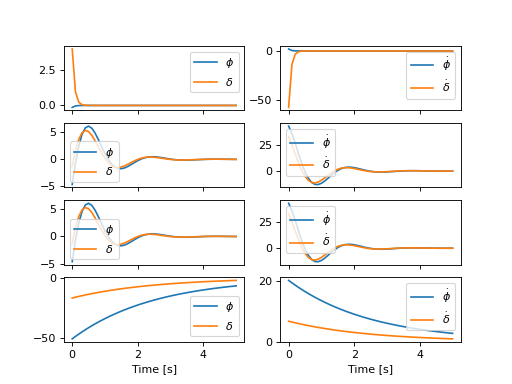
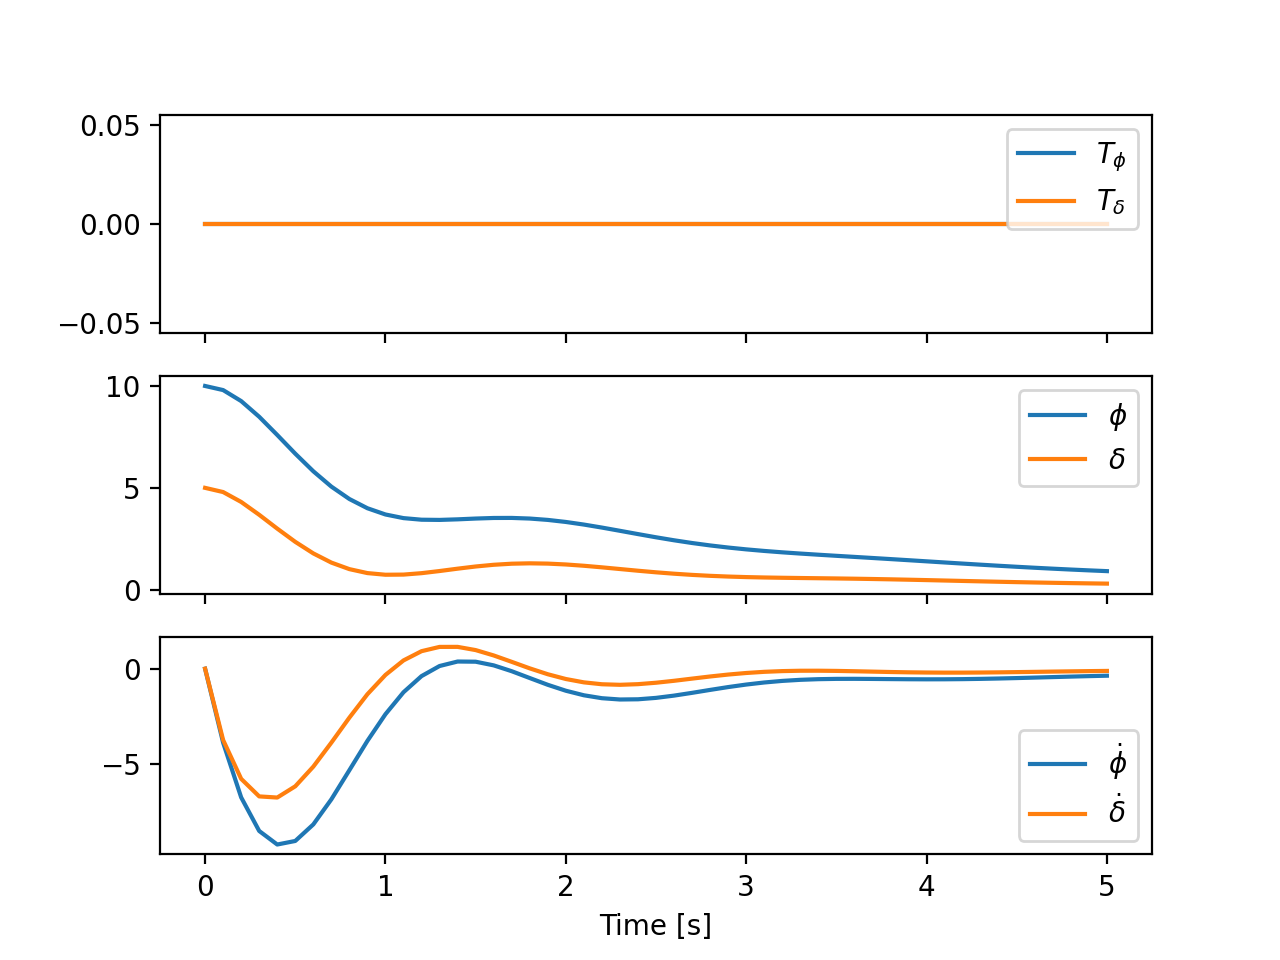
- plot_simulation(times, initial_conditions, input_func=None, **parameter_overrides)
Returns the state and input trajectories at each time value.
- Parameters:
- timesarray_like, shape(n,)
Monotonic increasing time values to simulate over.
- initial_conditionsarray_like, shape(4,)
Initial values of the states.
- input_funcfunction
Takes form u = f(t, x) where u is array_like, shape(2,).
- **parameter_overridesdictionary
Parameter keys that map to floats or array_like of floats shape(n,). All keys that map to array_like must be of the same length.
- Returns:
- axesndarray, shape(3,)
Three subplots that plot the input trajectories, state angle trajectories, and state angular rates.
Examples
import numpy as np
from bicycleparameters.parameter_dicts import meijaard2007_browser_jason
from bicycleparameters.parameter_sets import Meijaard2007ParameterSet
from bicycleparameters.models import Meijaard2007Model
p = Meijaard2007ParameterSet(meijaard2007_browser_jason, True)
m = Meijaard2007Model(p)
times = np.linspace(0.0, 5.0, num=51)
x0 = np.deg2rad([10.0, 5.0, 0.0, 0.0])
m.plot_simulation(times, x0, v=6.0)
(
Source code,png,hires.png,pdf)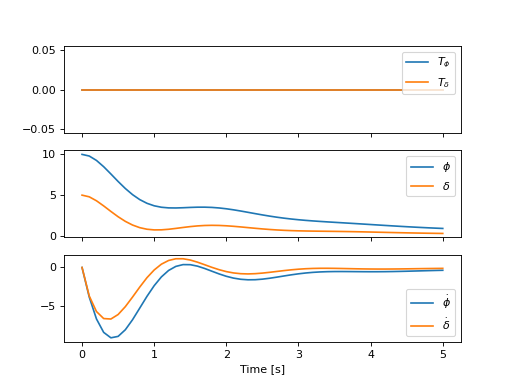
- simulate(times, initial_conditions, input_func=None, **parameter_overrides)
Returns the state and input trajectories at each time value.
- Parameters:
- timesarray_like, shape(n,)
Monotonic increasing time values to simulate over.
- initial_conditionsarray_like, shape(4,)
Initial values of the states.
- input_funcfunction
Takes form u = f(t, x) where u is array_like, shape(2,).
- **parameter_overridesdictionary
Parameter keys that map to floats or array_like of floats shape(n,). All keys that map to array_like must be of the same length.
- Returns:
- statesndarray, shape(n, 4)
State trajectories over n time values.
- inputsndatrray, shape(n, 2)
Input trajectories over n time values.
- simulate_modes(times, **parameter_overrides)
Returns simulation results showing the behavior of each eigenmode.
- Parameters:
- timesarray_like, shape(n,)
Monotonic increasing time values to simulate over.
- **parameter_overridesdictionary
Parameter keys that map to floats or array_like of floats shape(n,). All keys that map to array_like must be of the same length.
- Returns:
- resultsndarray, shape(4, n, 4)
State trajectories for each mode with the shape corresponding to (mode, time, state).
- state_vars = ['phi', 'delta', 'phidot', 'deltadot']
- state_vars_latex = ['\\phi', '\\delta', '\\dot{\\phi}', '\\dot{\\delta}']
parameter_sets Module
- class Meijaard2007ParameterSet(parameters, includes_rider)
Bases:
ParameterSetRepresents the parameters of the benchmark bicycle presented in [Meijaard2007].
The four bodies are:
B: rear frame + rigid rider
F: front wheel
H: front frame (fork & handlebars)
R: rear wheel
- Parameters:
- parametersdictionary
A dictionary mapping variable names to values that contains the following keys:
IBxx: x moment of inertia of the frame/rider [kg*m**2]IBxz: xz product of inertia of the frame/rider [kg*m**2]IBzz: z moment of inertia of the frame/rider [kg*m**2]IFxx: x moment of inertia of the front wheel [kg*m**2]IFyy: y moment of inertia of the front wheel [kg*m**2]IHxx: x moment of inertia of the handlebar/fork [kg*m**2]IHxz: xz product of inertia of the handlebar/fork [kg*m**2]IHzz: z moment of inertia of the handlebar/fork [kg*m**2]IRxx: x moment of inertia of the rear wheel [kg*m**2]IRyy: y moment of inertia of the rear wheel [kg*m**2]c: trail [m]g: acceleration due to gravity [m/s**2]lam: steer axis tilt [rad]mB: frame/rider mass [kg]mF: front wheel mass [kg]mH: handlebar/fork assembly mass [kg]mR: rear wheel mass [kg]rF: front wheel radius [m]rR: rear wheel radius [m]w: wheelbase [m]xB: x distance to the frame/rider center of mass [m]xH: x distance to the frame/rider center of mass [m]zB: z distance to the frame/rider center of mass [m]zH: z distance to the frame/rider center of mass [m]
- includes_riderboolean
True if body B is the combined rear frame and rider in terms of mass and inertia values.
References
[Meijaard2007]Meijaard J.P, Papadopoulos Jim M, Ruina Andy and Schwab A.L, 2007, Linearized dynamics equations for the balance and steer of a bicycle: a benchmark and review, Proc. R. Soc. A., 463:1955–1982 http://doi.org/10.1098/rspa.2007.1857
- Attributes:
- par_stringsdictionary
Maps ASCII strings to their LaTeX string.
- body_labelslist of strings
Single capital letters that correspond to the four rigid bodies in the model.
- body_labels = ['B', 'F', 'H', 'R']
- form_inertia_tensor(body)
Returns the inertia tensor with respect to the global coordinate system and the body’s mass center.
- Parameters:
- bodystring
One of the
body_labels.
- Returns:
- inertia_tensorndarray, shape(3, 3)
Inertia tensor of the body with respect to the body’s mass center and the model’s coordinate system.
Examples
>>> from bicycleparameters.parameter_dicts import meijaard2007_browser_jason
>>> from bicycleparameters.parameter_sets import Meijaard2007ParameterSet
>>> p = Meijaard2007ParameterSet(meijaard2007_browser_jason, True)
>>> p.form_inertia_tensor('H')
array([[ 0.25337959,  0.        , -0.07204524],
       [ 0.        ,  0.24613881,  0.        ],
       [-0.07204524,  0.        ,  0.09557708]])
- form_mass_center_vector(body)
Returns an array representing the 3D vector to the mass center of the body from the origin at the rear wheel contact point.
- Parameters:
- bodystring
One of ‘B’, ‘F’, ‘H’, ‘R’.
- Returns:
- ndarray, shape(3,)
A vector containing the X, Y, and X coordinates of the mass center of the body.
Examples
>>> from bicycleparameters.parameter_dicts import meijaard2007_browser_jason
>>> from bicycleparameters.parameter_sets import Meijaard2007ParameterSet
>>> p = Meijaard2007ParameterSet(meijaard2007_browser_jason, True)
>>> p.form_mass_center_vector('B')
array([ 0.28909943,  0.        , -1.04029228])
- mass_center_of(*bodies)
Returns the vector locating the center of mass of the collection of bodies.
- Parameters:
- bodiesiterable of strings
One or more of the
body_labels.
- Returns:
- comndarray, shape(3,)
Vector locating the center of mass of the bodies givien in
bodies.
Examples
>>> from bicycleparameters.parameter_dicts import meijaard2007_browser_jason
>>> from bicycleparameters.parameter_sets import Meijaard2007ParameterSet
>>> p = Meijaard2007ParameterSet(meijaard2007_browser_jason, True)
>>> p.mass_center_of('B', 'H')
array([ 0.31096918,  0.        , -1.02923892])
- par_strings = {'IBxx': 'I_{Bxx}', 'IBxz': 'I_{Bxz}', 'IByy': 'I_{Byy}', 'IBzz': 'I_{Bzz}', 'IFxx': 'I_{Fxx}', 'IFyy': 'I_{Fyy}', 'IHxx': 'I_{Hxx}', 'IHxz': 'I_{Hxz}', 'IHyy': 'I_{Hyy}', 'IHzz': 'I_{Hzz}', 'IRxx': 'I_{Rxx}', 'IRyy': 'I_{Ryy}', 'c': 'c', 'g': 'g', 'lam': '\\lambda', 'mB': 'm_B', 'mF': 'm_F', 'mH': 'm_H', 'mR': 'm_R', 'rF': 'r_F', 'rR': 'r_R', 'v': 'v', 'w': 'w', 'xB': 'x_B', 'xH': 'x_H', 'zB': 'z_B', 'zH': 'z_H'}
- plot_all(ax=None)
Returns matplotlib axes with the geometry and inertial representations of all bodies of the bicycle parameter set.
- Parameters:
- axAxesSubplot, optional
An axes to draw on, otherwise one is created.
Examples
from bicycleparameters.parameter_dicts import meijaard2007_browser_jason
from bicycleparameters.parameter_sets import Meijaard2007ParameterSet
p = Meijaard2007ParameterSet(meijaard2007_browser_jason, True)
p.plot_all()
(
Source code,png,hires.png,pdf)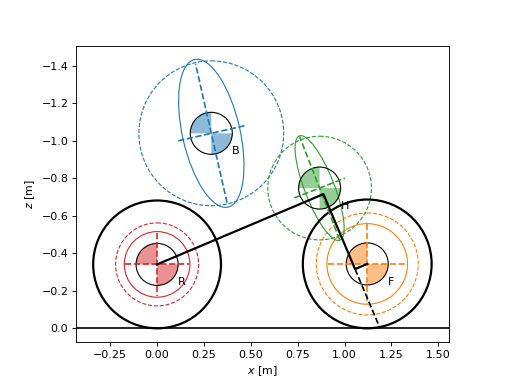
- plot_body_mass_center(body, ax=None)
Returns a matplotlib axes with a mass center symbol for the specified body to the plot.
- Parameters:
- bodystring
The body string:
F,H,B, orR.- axSubplotAxes, optional
Axes to plot on.
Examples
from bicycleparameters.parameter_dicts import meijaard2007_browser_jason
from bicycleparameters.parameter_sets import Meijaard2007ParameterSet
p = Meijaard2007ParameterSet(meijaard2007_browser_jason, True)
p.plot_body_mass_center('B')
(
Source code,png,hires.png,pdf)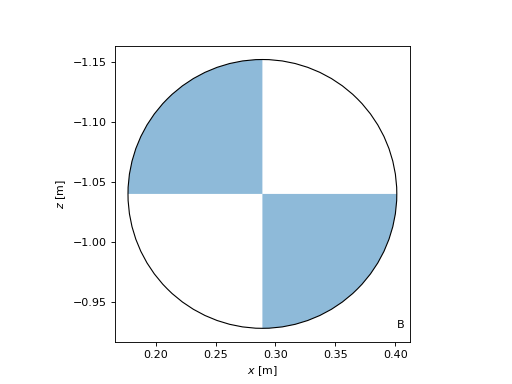
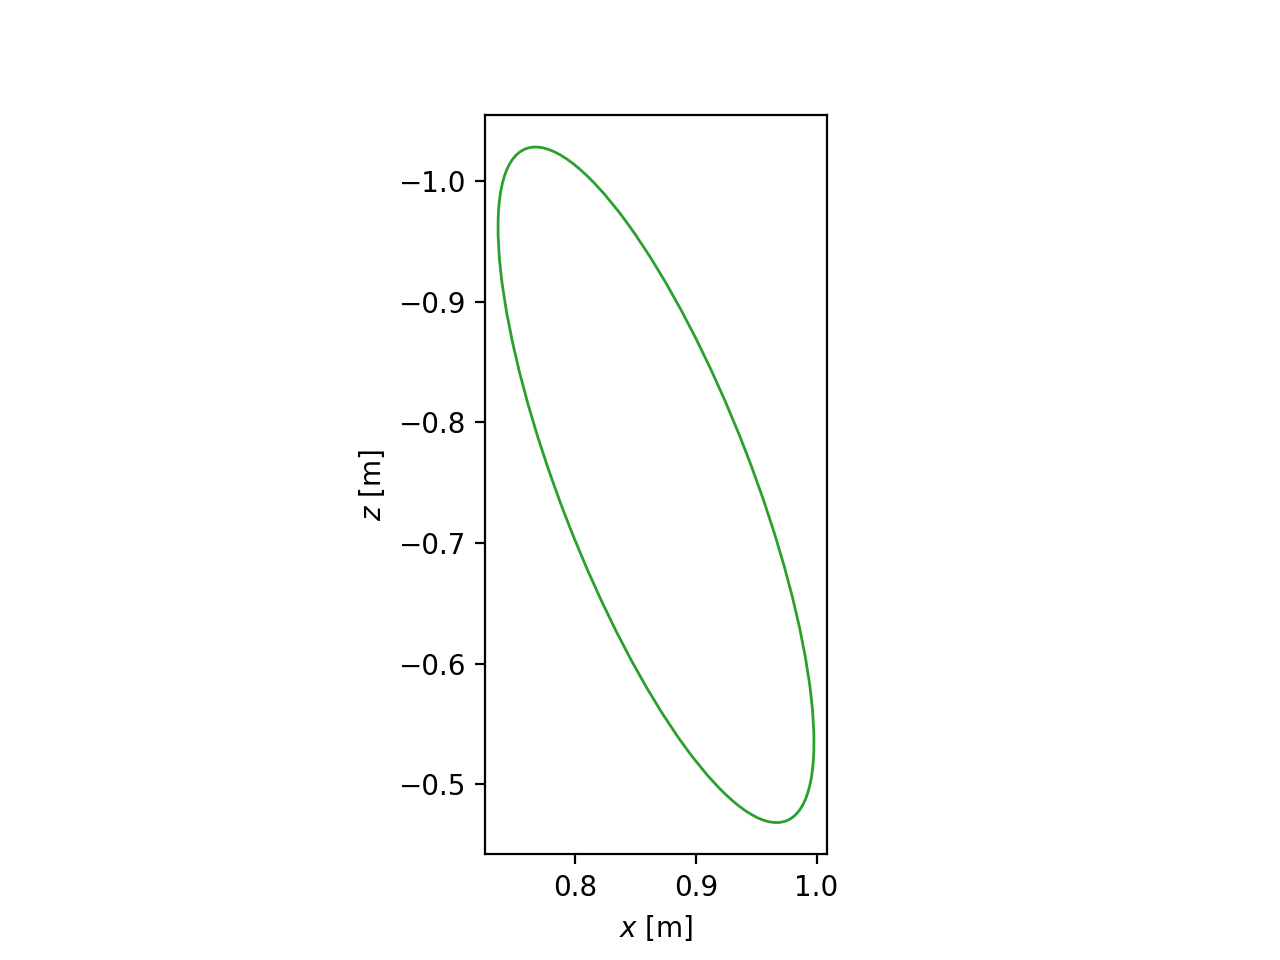
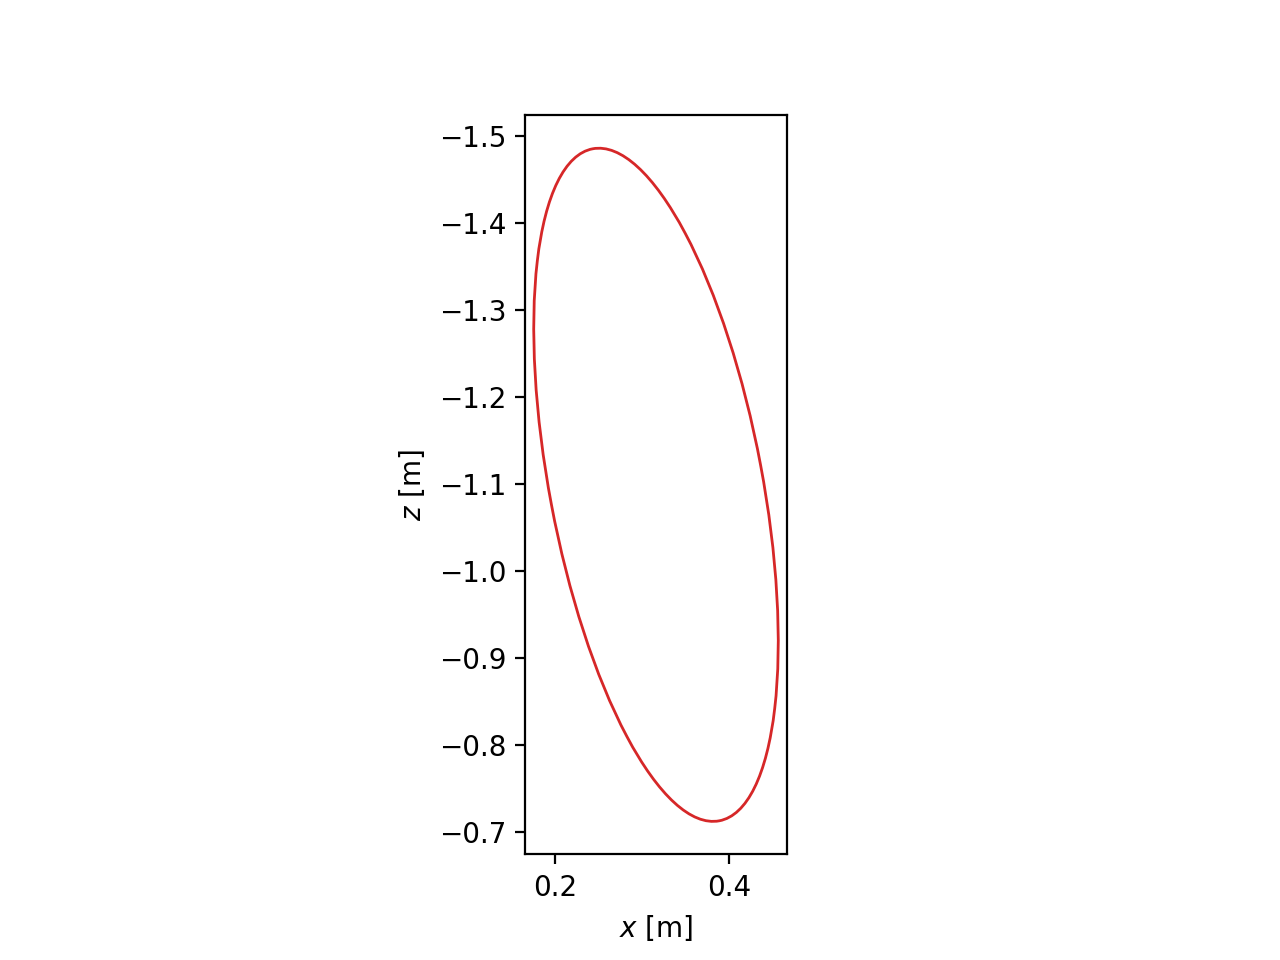
- plot_body_principal_inertia_ellipsoid(body, ax=None)
Returns a matplotlib axes with an ellipse that respresnts the XZ plane view of a constant density ellipsoid which has the same principal moments and axes of inertia as the body.
- Parameters:
- bodystring
One of the
body_labels.- axSubplotAxes, optional
Axes to plot on.
Examples
from bicycleparameters.parameter_dicts import meijaard2007_browser_jason
from bicycleparameters.parameter_sets import Meijaard2007ParameterSet
p = Meijaard2007ParameterSet(meijaard2007_browser_jason, True)
p.plot_body_principal_inertia_ellipsoid('H')
(
Source code,png,hires.png,pdf)
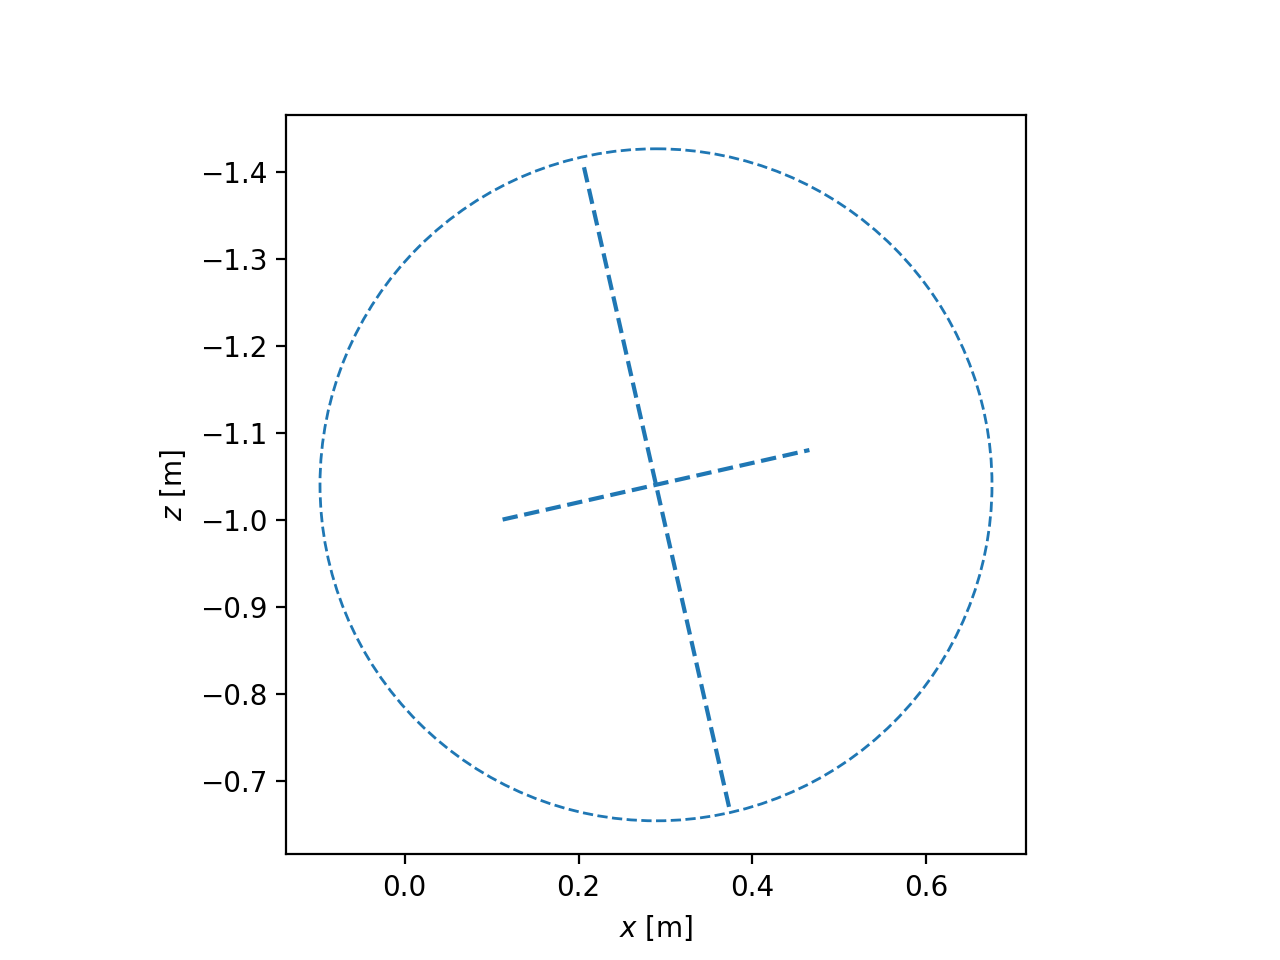
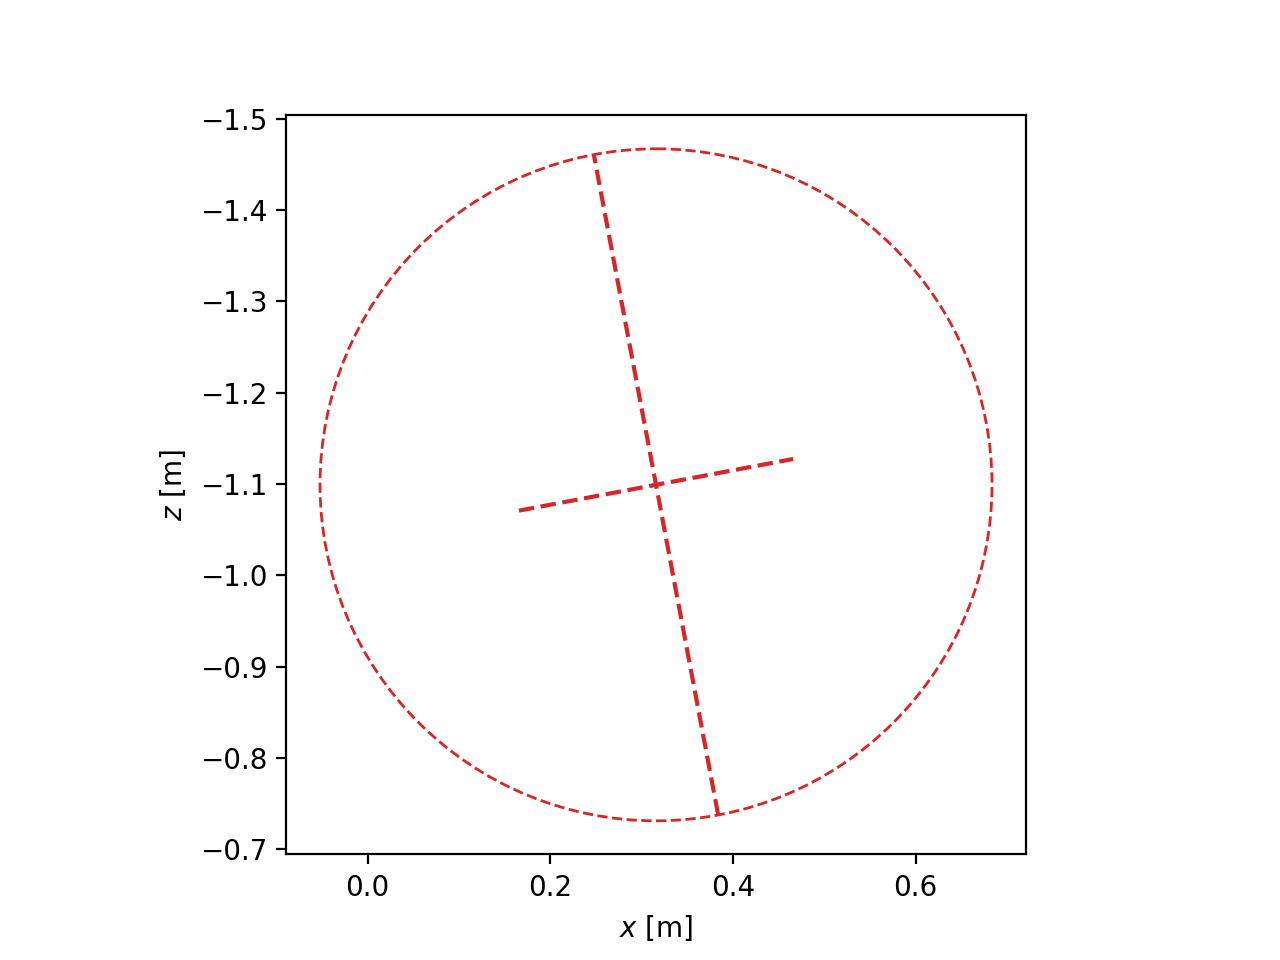
- plot_body_principal_radii_of_gyration(body, ax=None)
Returns a matplotlib axes with lines and a circle that indicate the principal radii of gyration of the specified body.
- Parameters:
- bodystring
One of the
body_labels.- axSubplotAxes, optional
Axes to plot on.
Examples
from bicycleparameters.parameter_dicts import meijaard2007_browser_jason
from bicycleparameters.parameter_sets import Meijaard2007ParameterSet
p = Meijaard2007ParameterSet(meijaard2007_browser_jason, True)
p.plot_body_principal_radii_of_gyration('B')
(
Source code,png,hires.png,pdf)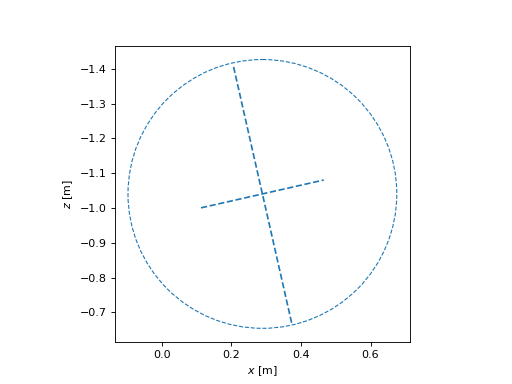
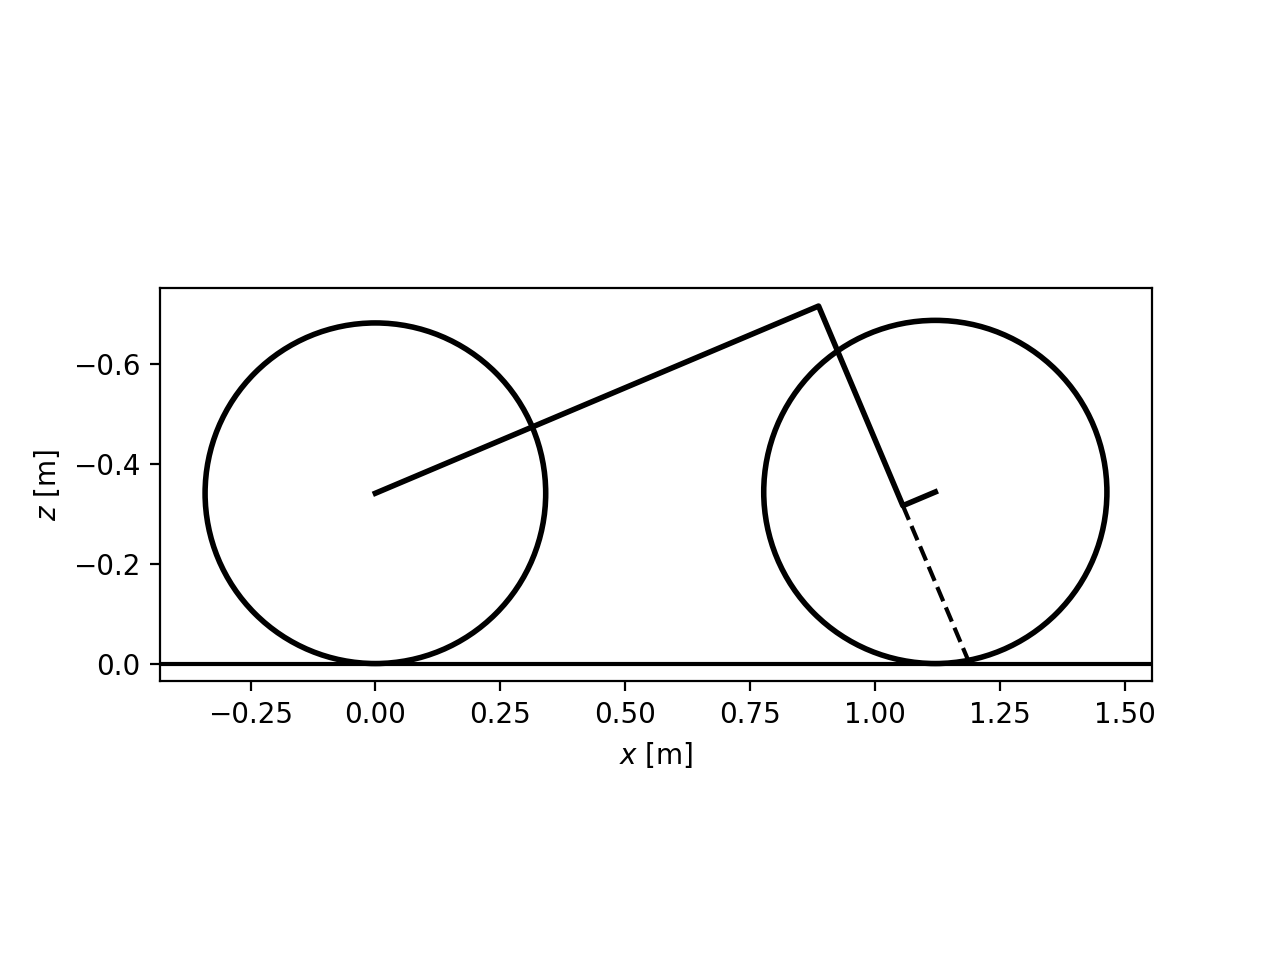
- plot_geometry(show_steer_axis=True, ax=None)
Returns a matplotlib axes with a simple drawing of the bicycle’s geometry.
- Parameters:
- show_steer_axisboolean
If true, a dotted line will be plotted along the steer axis from the front wheel center to the ground.
- axAxesSubplot, optional
An axes to draw on, otherwise one is created.
Examples
from bicycleparameters.parameter_dicts import meijaard2007_browser_jason
from bicycleparameters.parameter_sets import Meijaard2007ParameterSet
p = Meijaard2007ParameterSet(meijaard2007_browser_jason, True)
p.plot_geometry()
(
Source code,png,hires.png,pdf)
- plot_mass_centers(bodies=None, ax=None)
Returns a matplotlib axes with mass center indicators for each body.
- Parameters:
- bodies: list of strings, optional
A subset of the strings present in the class attribute
body_labels.- ax: matplotlib Axes, optional
An axes to plot on.
Examples
from bicycleparameters.parameter_dicts import meijaard2007_browser_jason
from bicycleparameters.parameter_sets import Meijaard2007ParameterSet
p = Meijaard2007ParameterSet(meijaard2007_browser_jason, True)
p.plot_mass_centers()
(
Source code,png,hires.png,pdf)
- plot_principal_inertia_ellipsoids(bodies=None, ax=None)
Returns a Matplotlib axes with 2D representations of 3D solid uniform ellipsoids that have the same inertia as the body.
- Parameters:
- bodies: list of strings, optional
A subset of the strings present in the class attribute
body_labels.- axAxesSubplot, optional
An axes to draw on, otherwise one is created.
Examples
from bicycleparameters.parameter_dicts import meijaard2007_browser_jason
from bicycleparameters.parameter_sets import Meijaard2007ParameterSet
p = Meijaard2007ParameterSet(meijaard2007_browser_jason, True)
p.plot_principal_inertia_ellipsoids()
(
Source code,png,hires.png,pdf)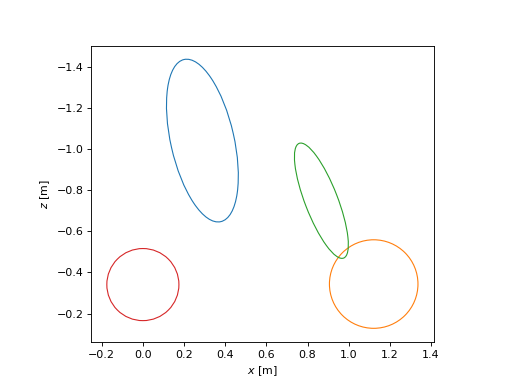
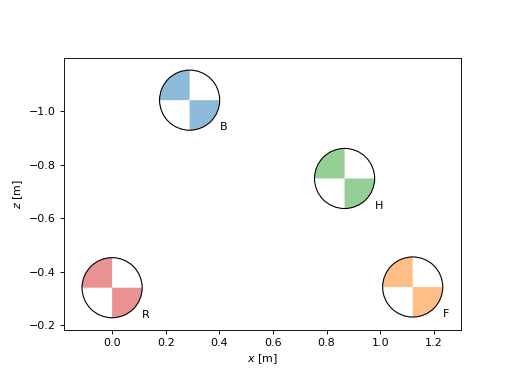
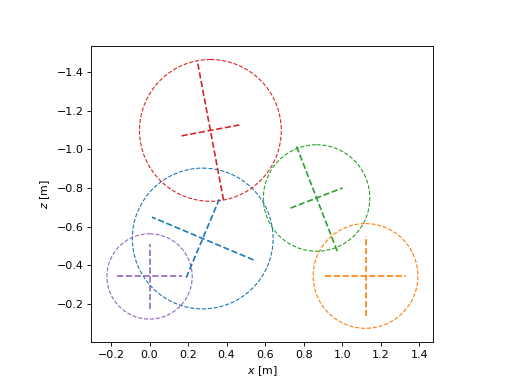
- plot_principal_radii_of_gyration(bodies=None, ax=None)
Returns a matplotlib axis with principal radii of all bodies shown.
- Parameters:
- bodies: list of strings, optional
A subset of the strings present in the class attribute
body_labels.- ax: matplotlib Axes, optional
An axes to plot on.
Examples
from bicycleparameters.parameter_dicts import meijaard2007_browser_jason
from bicycleparameters.parameter_sets import Meijaard2007ParameterSet
p = Meijaard2007ParameterSet(meijaard2007_browser_jason, True)
p.plot_principal_radii_of_gyration()
(
Source code,png,hires.png,pdf)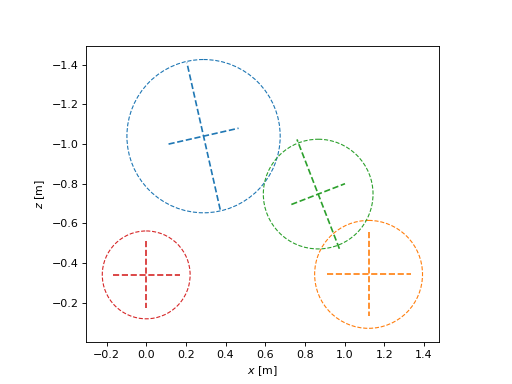
- class Moore2019ParameterSet(parameters)
Bases:
ParameterSetRepresents the parameters of the bicycle parameterization presented in [1].
The four bodies are:
D: rear frame
F: front wheel
H: front frame (fork & handlebars)
P: rigid rider
R: rear wheel
- Parameters:
- parametersdictionary
A dictionary mapping variable names to values.
References
[1]Moore, Jason K.; Hubbard, Mont (2019): Expanded Optimization for Discovering Optimal Lateral Handling Bicycles. Proceedings of Bicycle and Motorcycle Dynamics 2019: A Symposium on the Dynamics and Control of Single Track Vehicles https://doi.org/10.6084/m9.figshare.9942938.v1
- Attributes:
- par_stringsdictionary
Maps ASCII strings to their LaTeX string.
- body_labelslist of strings
Single capital letters that correspond to the five rigid bodies in the model.
- body_labels = ['D', 'F', 'H', 'P', 'R']
- form_mass_center_vector(body)
Returns an array representing the vector to the mass center of the body.
- Parameters:
- bodystring
One of ‘P’, ‘D’, ‘F’, ‘H’, ‘R’.
- Returns:
- ndarray, shape(3,)
A vector containing the X, Y, and X coordinates of the mass center of the body.
- mass_center_of(*bodies)
Returns the vector locating the center of mass of the collection of bodies.
- Parameters:
- bodiesiterable of strings
Subset from
body_labels.
- Returns:
- comndarray, shape(3,)
Vector locating the center of mass of the bodies given in
bodies.
- non_min_par_strings = {'alphaF': '\\alpha_F', 'alphaR': '\\alpha_R', 'kFbb': 'k_{Fbb}', 'kRbb': 'k_{Rbb}', 'xF': 'x_F', 'xR': 'x_R', 'yD': 'y_D', 'yF': 'y_F', 'yH': 'y-H', 'yP': 'y_P', 'yR': 'y_R', 'zF': 'z_F', 'zR': 'z_R'}
- par_strings = {'alphaD': '\\alpha_D', 'alphaH': '\\alpha_H', 'alphaP': '\\alpha_P', 'c': 'c', 'g': 'g', 'kDaa': 'k_{Daa}', 'kDbb': 'k_{Dbb}', 'kDyy': 'k_{Dyy}', 'kFaa': 'k_{Faa}', 'kFyy': 'k_{Fyy}', 'kHaa': 'k_{Haa}', 'kHbb': 'k_{Hbb}', 'kHyy': 'k_{Hyy}', 'kPaa': 'k_{Paa}', 'kPbb': 'k_{Pbb}', 'kPyy': 'k_{Pyy}', 'kRaa': 'k_{Raa}', 'kRyy': 'k_{Ryy}', 'lP': 'l_P', 'lam': '\\lambda', 'mD': 'm_D', 'mF': 'm_F', 'mH': 'm_H', 'mP': 'm_B', 'mR': 'm_R', 'rF': 'r_F', 'rR': 'r_R', 'v': 'v', 'w': 'w', 'wP': 'w_P', 'xD': 'x_D', 'xH': 'x_H', 'xP': 'x_P', 'zD': 'z_D', 'zH': 'z-H', 'zP': 'z_P'}
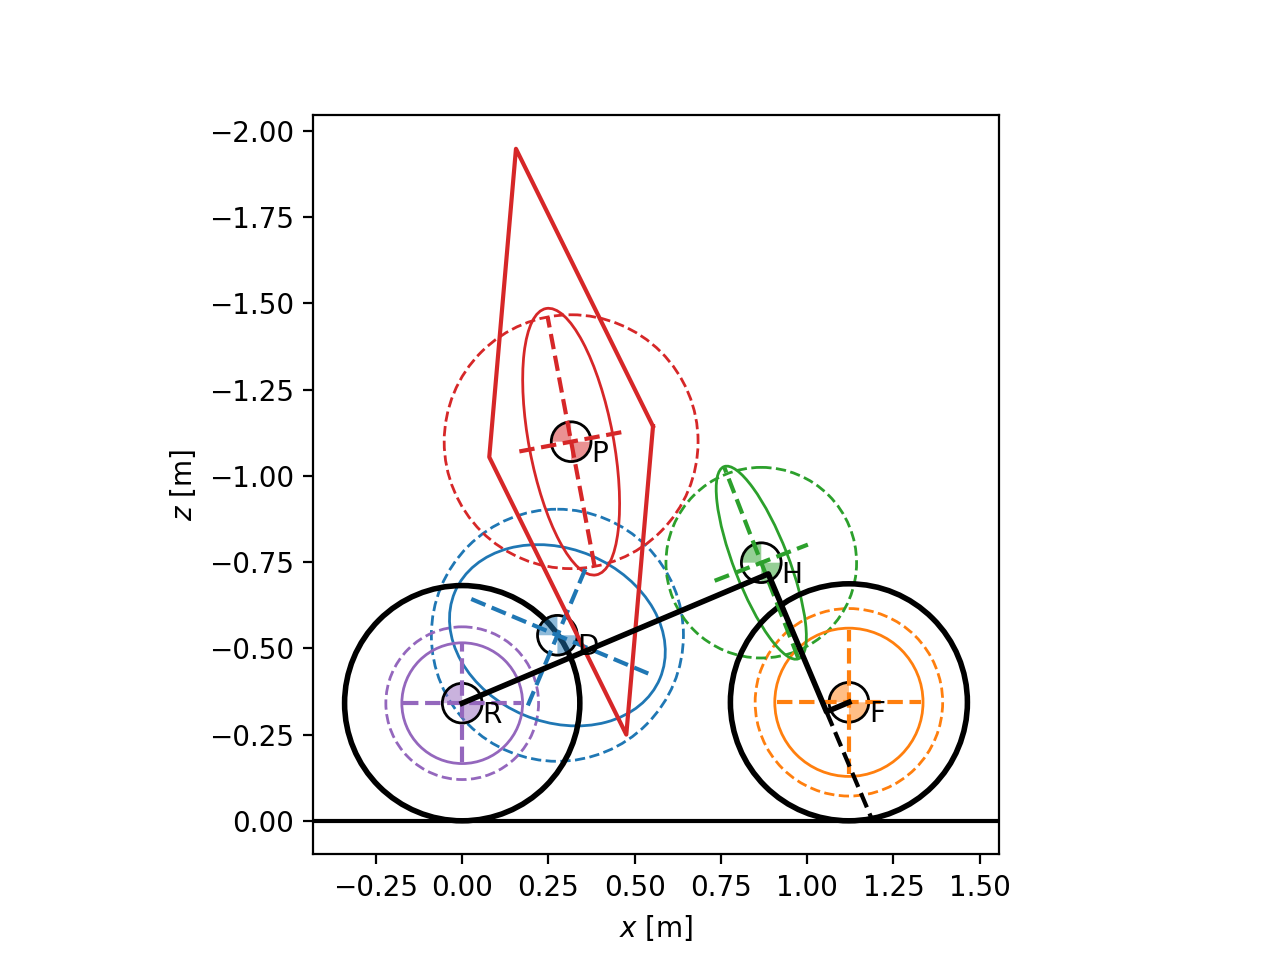
- plot_all(ax=None)
Returns matplotlib axes with the geometry and inertial representations of all bodies of the bicycle parameter set.
- Parameters:
- ax: matplotlib Axes, optional
An axes to plot on.
Examples
from bicycleparameters.parameter_dicts import moore2019_browser_jason
from bicycleparameters.parameter_sets import Moore2019ParameterSet
p = Moore2019ParameterSet(moore2019_browser_jason)
p.plot_all()
(
Source code,png,hires.png,pdf)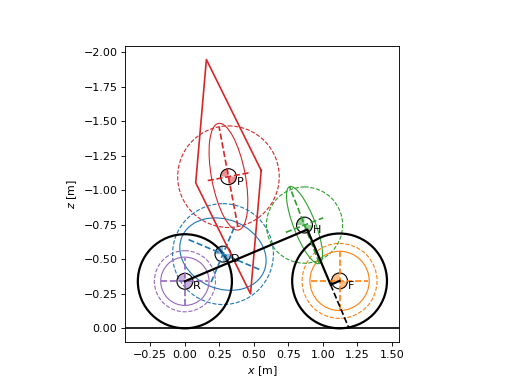
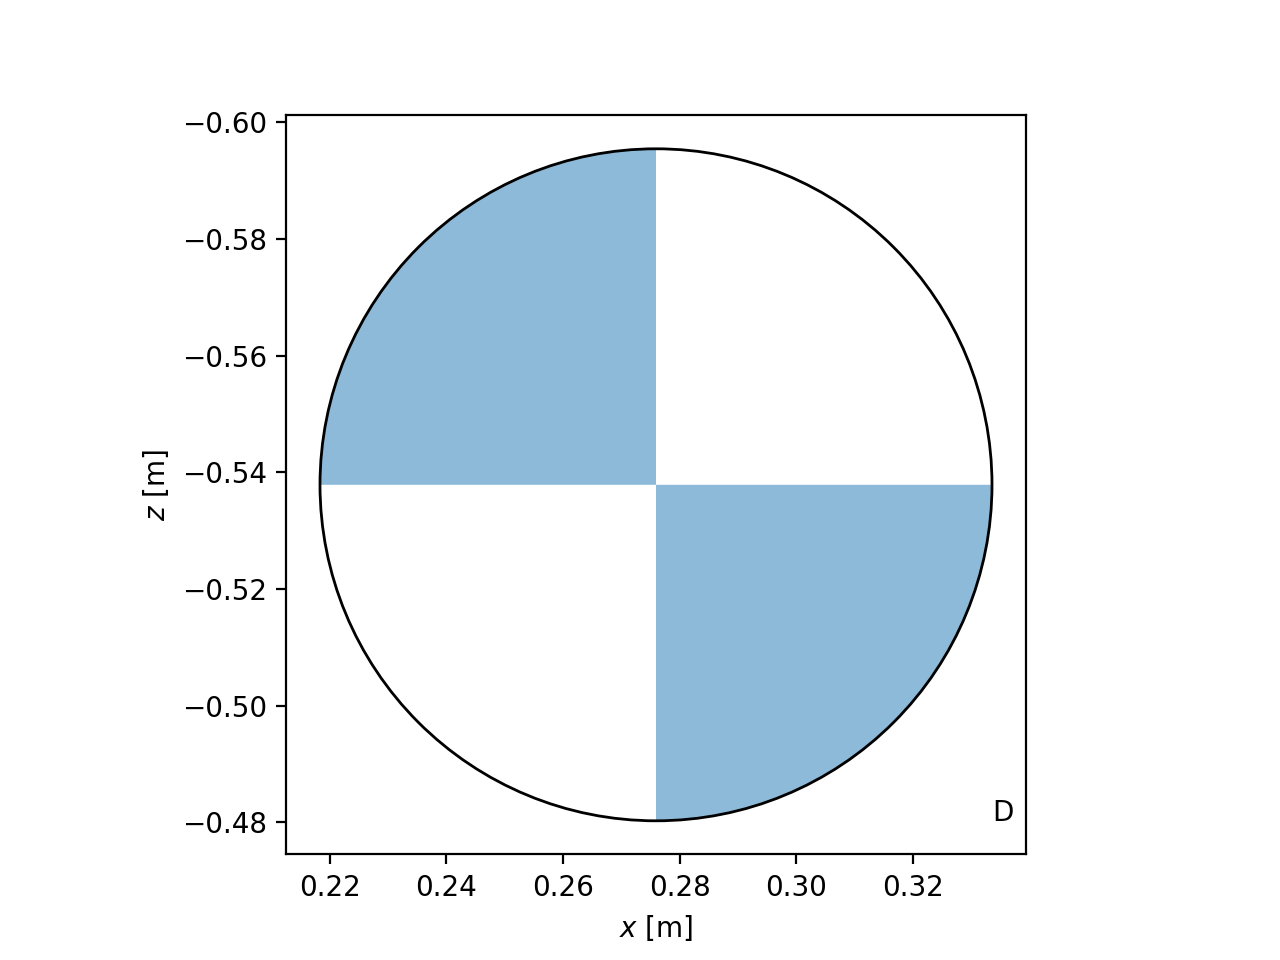
- plot_body_mass_center(body, ax=None)
Returns a matplotlib axes with a mass center symbol for the specified body to the plot.
- Parameters:
- bodystring
The body string: D, F, H, P, or R
- axSubplotAxes, optional
Axes to plot on.
Examples
from bicycleparameters.parameter_dicts import moore2019_browser_jason
from bicycleparameters.parameter_sets import Moore2019ParameterSet
p = Moore2019ParameterSet(moore2019_browser_jason)
p.plot_body_mass_center('D')
(
Source code,png,hires.png,pdf)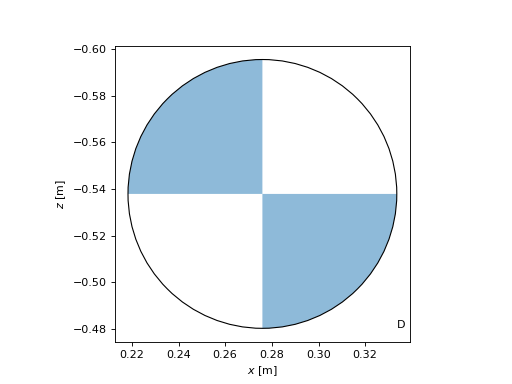
- plot_body_principal_inertia_ellipsoid(body, ax=None)
Returns a matplotlib axes with an ellipse that respresnts the XZ plane view of a constant density ellipsoid which has the same principal moments and axes of inertia as the body.
- Parameters:
- bodystring
The body string: D, F, H, P, or R
- axSubplotAxes, optional
Axes to plot on.
Examples
from bicycleparameters.parameter_dicts import moore2019_browser_jason
from bicycleparameters.parameter_sets import Moore2019ParameterSet
p = Moore2019ParameterSet(moore2019_browser_jason)
p.plot_body_principal_inertia_ellipsoid('P')
(
Source code,png,hires.png,pdf)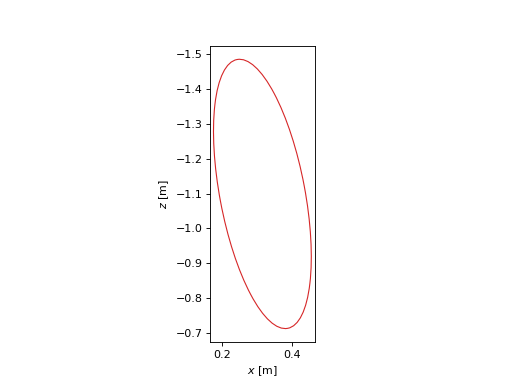
- plot_body_principal_radii_of_gyration(body, ax=None)
Returns a matplotlib axes with lines and a circle that indicate the principal radii of gyration of the specified body.
- Parameters:
- bodystring
The body string: D, F, H, P, or R
- axSubplotAxes, optional
Axes to plot on.
Examples
from bicycleparameters.parameter_dicts import moore2019_browser_jason
from bicycleparameters.parameter_sets import Moore2019ParameterSet
p = Moore2019ParameterSet(moore2019_browser_jason)
p.plot_body_principal_radii_of_gyration('P')
(
Source code,png,hires.png,pdf)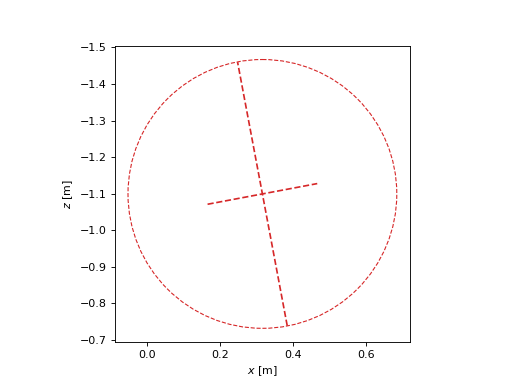
- plot_geometry(show_steer_axis=True, ax=None)
Returns a matplotlib axes with the simplest drawing of the bicycle’s geometry.
- Parameters:
- show_steer_axisboolean
If true, a dotted line will be plotted along the steer axis from the front wheel center to the ground.
- axAxesSubplot, optional
An axes to draw on, otherwise one is created.
Examples
from bicycleparameters.parameter_dicts import moore2019_browser_jason
from bicycleparameters.parameter_sets import Moore2019ParameterSet
p = Moore2019ParameterSet(moore2019_browser_jason)
p.plot_geometry()
(
Source code,png,hires.png,pdf)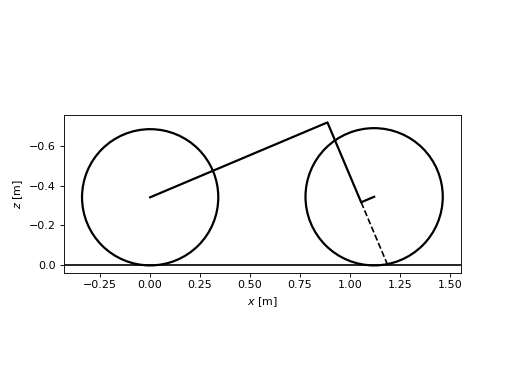
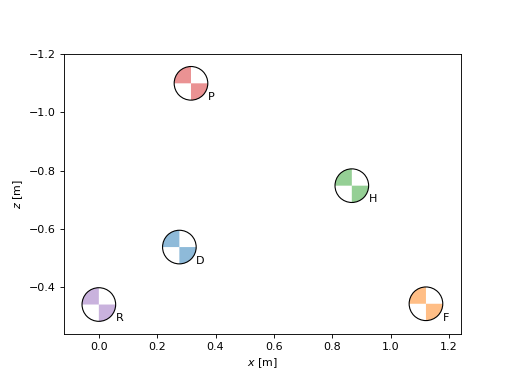
- plot_mass_centers(bodies=None, ax=None)
Returns a matplotlib axes with a mass center symbols for the specified bodies to the plot.
- Parameters:
- bodies: list of strings, optional
A subset of the strings present in the class attribute
body_labels.- ax: matplotlib Axes, optional
An axes to plot on.
Examples
from bicycleparameters.parameter_dicts import moore2019_browser_jason
from bicycleparameters.parameter_sets import Moore2019ParameterSet
p = Moore2019ParameterSet(moore2019_browser_jason)
p.plot_mass_centers()
(
Source code,png,hires.png,pdf)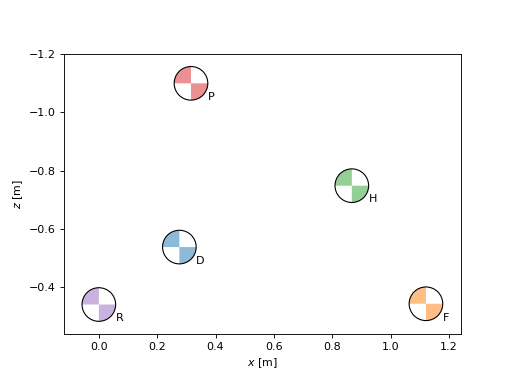
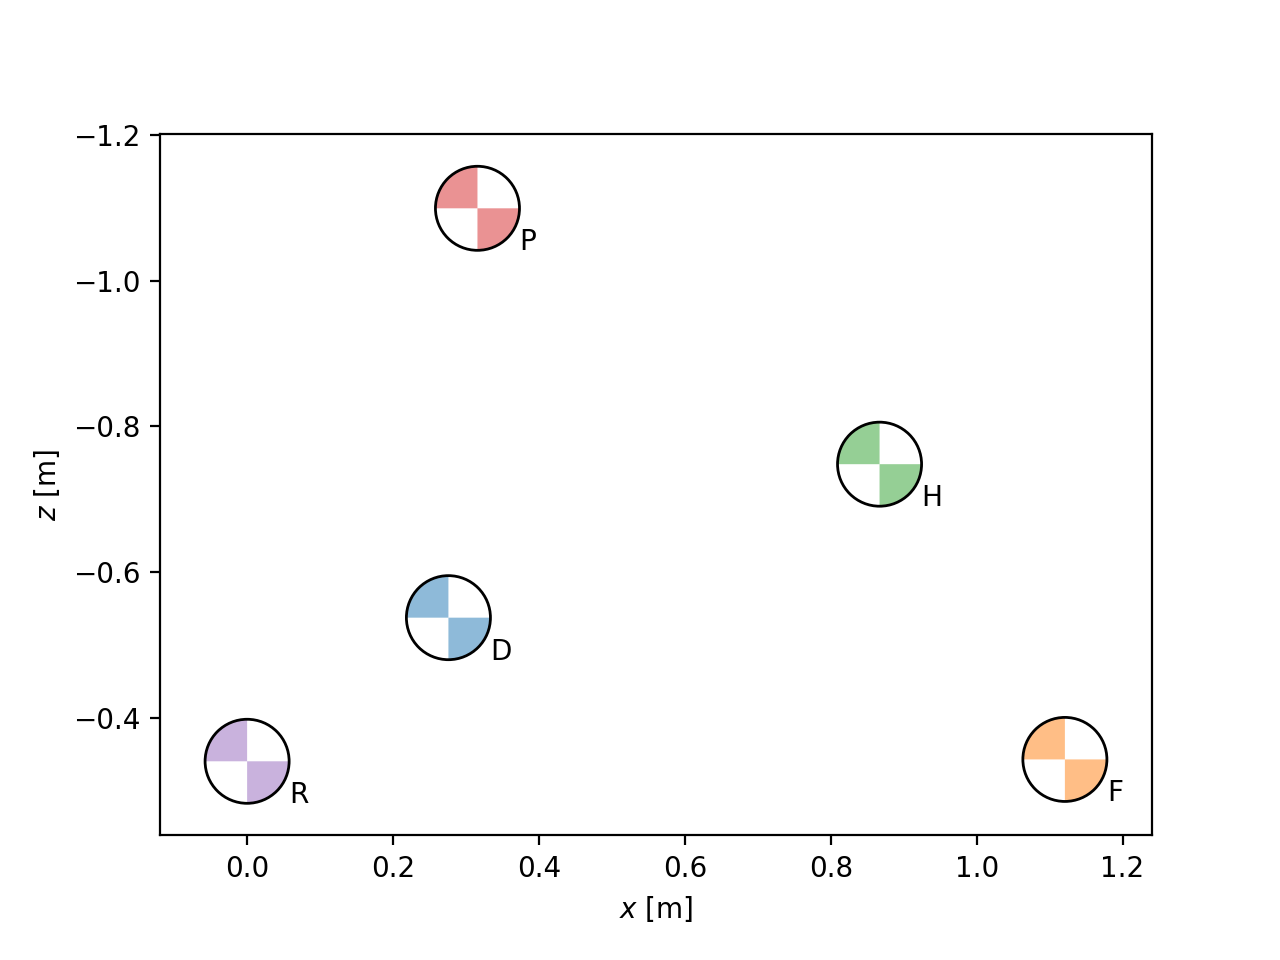
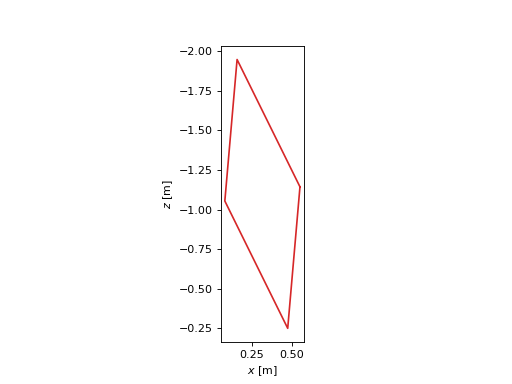
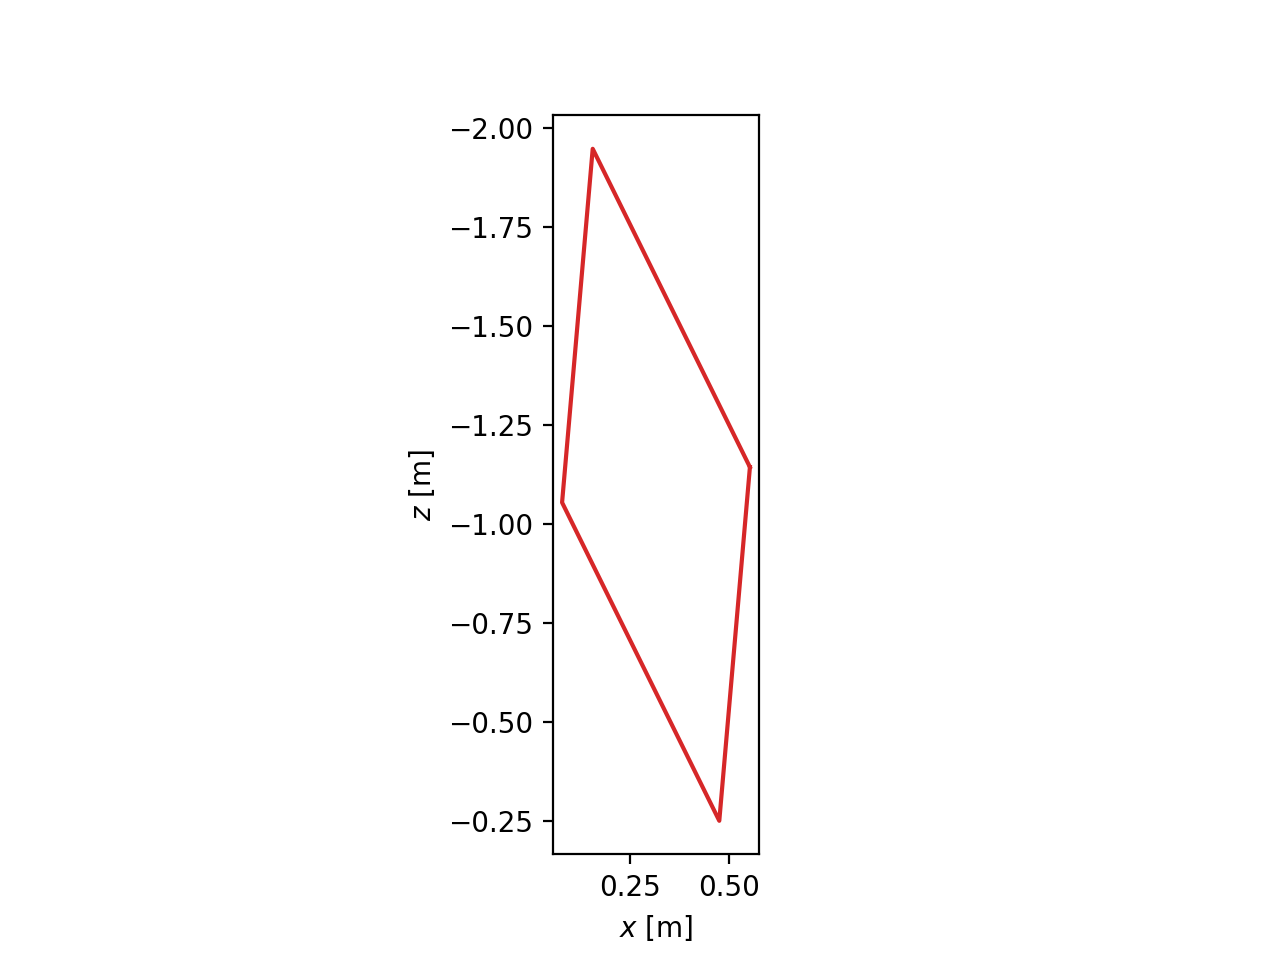
- plot_person_diamond(show_cross=False, ax=None)
Plots a diamond that represents the approximate person’s physical extents.
- Parameters:
- show_crossboolean, optional
Plots a cross in the diamond that spans opposite vertices.
- axAxesSubplot, optional
An axes to draw on, otherwise one is created.
Examples
from bicycleparameters.parameter_dicts import moore2019_browser_jason
from bicycleparameters.parameter_sets import Moore2019ParameterSet
p = Moore2019ParameterSet(moore2019_browser_jason)
p.plot_person_diamond()
(
Source code,png,hires.png,pdf)
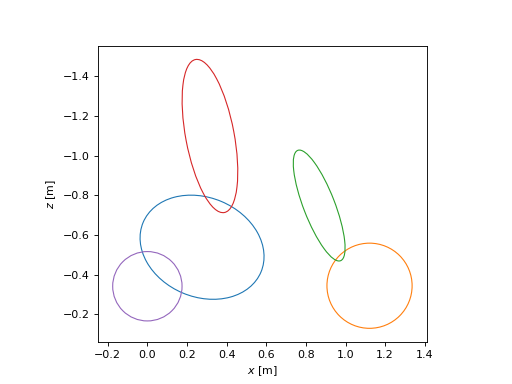
- plot_principal_inertia_ellipsoids(bodies=None, ax=None)
Returns a Matplotlib axes with 2D representations of 3D solid uniform ellipsoids that have the same inertia as the body.
- Parameters:
- bodies: list of strings, optional
A subset of the strings present in the class attribute
body_labels.- ax: matplotlib Axes, optional
An axes to plot on.
Examples
from bicycleparameters.parameter_dicts import moore2019_browser_jason
from bicycleparameters.parameter_sets import Moore2019ParameterSet
p = Moore2019ParameterSet(moore2019_browser_jason)
p.plot_principal_inertia_ellipsoids()
(
Source code,png,hires.png,pdf)
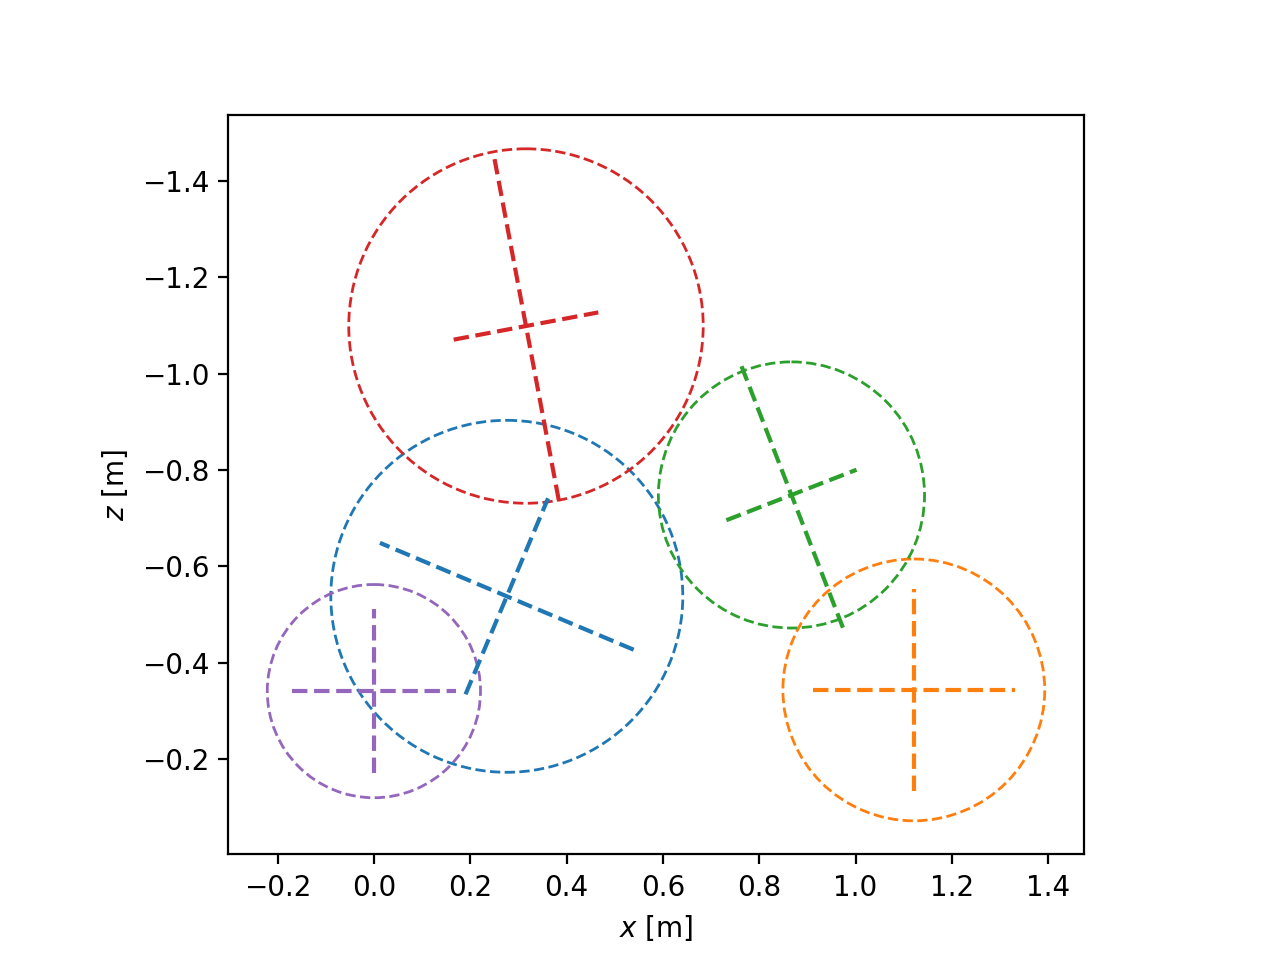
- plot_principal_radii_of_gyration(bodies=None, ax=None)
Returns a matplotlib axes with lines and a circle that indicate the principal radii of gyration for all five bodies.
- Parameters:
- bodieslist of strings, optional
Either [‘D’, ‘F’, ‘H’, ‘P’, ‘R’] or a subset thereof.
- axAxesSubplot, optional
An axes to draw on, otherwise one is created.
Examples
from bicycleparameters.parameter_dicts import moore2019_browser_jason
from bicycleparameters.parameter_sets import Moore2019ParameterSet
p = Moore2019ParameterSet(moore2019_browser_jason)
p.plot_principal_radii_of_gyration()
(
Source code,png,hires.png,pdf)
- to_parameterization(name)
Returns a specific parameter set based on the provided parameterization name.
- Parameters:
- namestring
The name of the parameterization. These should correspond to a subclass of a
ParameterSetand the name will be the string that precedes “ParameterSet”. For example, the parameterization name ofMeijaard2007ParameterSetisMeijaard2007.
- Returns:
- ParmeterSet
If a different parameterization is requested and this class can convert itself, it will return a new parameter set of the correct parameterization.
Examples
>>> from bicycleparameters.parameter_dicts import moore2019_browser_jason
>>> from bicycleparameters.parameter_sets import Moore2019ParameterSet
>>> moore_set = Moore2019ParameterSet(moore2019_browser_jason)
>>> moore_set.mass_center_of('P', 'D')
array([ 0.31156277,  0.        , -1.03972442])
>>> meijaard_set = moore_set.to_parameterization('Meijaard2007')
>>> meijaard_set.mass_center_of('B')
array([ 0.31156277,  0.        , -1.03972442])
- class ParameterSet(par_dict)
Bases:
ABCA parameter set is a collection of constants with associated floating point values that are present in a set of differential algebraic equations that represent a multibody bicycle model. These pairs are typically defined in a specific academic article, dissertation, book chapter, or section and subclasses should be named in a way that ties them to that written work. Parameter sets must be named with this pattern
NameOfMySetParameterSetwhereNameOfMySetis a unique name other than something that includesParameterSet.A parameter set, or a subset of the parameters, can be used with multiple different models. A parameter set is associated with a particular parameterization of one or more models. Parameter sets can be converted to equivalent parameter sets, but only by assuming a particular model configuration. The obvious configuration for a bicycle model is the upright, zero steer state. But if, for example, a rider configuration is included, then some nominal configuration would need to be defined for conversion consistency.
Each parameter set should have a unique set of ASCII strings that represent the constants in a model.
- Attributes:
- par_stringsdictionary
Maps ASCII strings to their LaTeX string.
- par_strings = {'aR': 'a_R', 'beta': '\\beta'}
- to_ini(fname)
Writes parameters to file in the INI format. Metadata is not included.
- Parameters:
- fnamestring
Path to file.
- to_parameterization(name)
Returns a specific parameter set based on the provided parameterization name.
- Parameters:
- namestring
The name of the parameterization. These should correspond to a subclass of a
ParameterSetand the name will be the string that precedes “ParameterSet”. For example, the parameterization name ofMeijaard2007ParameterSetisMeijaard2007.
- Returns:
- ParmeterSet
If a different parameterization is requested and this class can convert itself, it will return a new parameter set of the correct parameterization.
- to_yaml(fname)
Writes parameters to file in the YAML format.
- Parameters:
- fnamestring
Path to file.
period Module
- average_rectified_sections(data)
Returns a slice of an oscillating data vector based on the max and min of the mean of the sections created by retifiying the data.
- Parameters:
- datandarray, shape(n,)
- Returns:
- datandarray, shape(m,)
A slice where m is typically less than n.
Notes
This is a function to try to handle the fact that some of the data from the torsional pendulum had a beating like phenomena and we only want to select a section of the data that doesn’t seem to exhibit the phenomena.
- calc_periods_for_files(directory, filenames, forkIsSplit)
Calculates the period for all filenames in directory.
- Parameters:
- directorystring
This is the path to the RawData directory.
- filenameslist
List of all the mat file names in the RawData directory.
- forkIsSplitboolean
True if the fork is broken into a handlebar and fork and false if the fork and handlebar was measured together.
- Returns:
- periodsdictionary
Contains all the periods for the mat files in the RawData directory.
- check_for_period(mp, forkIsSplit)
Returns whether the fork is split into two pieces and whether the period calculations need to happen again.
- Parameters:
- mpdictionary
Dictionary the measured parameters.
- forkIsSplitboolean
True if the fork is broken into a handlebar and fork and false if the fork and handlebar was measured together.
- Returns:
- forcePeriodCalcboolean
True if there wasn’t enough period data in mp, false if there was.
- forkIsSplitboolean
True if the fork is broken into a handlebar and fork and false if the fork and handlebar was measured together.
- fit_goodness(ym, yp)
Calculate the goodness of fit.
- Parameters:
- ymndarray, shape(n,)
The vector of measured values.
- ypndarry, shape(n,)
The vector of predicted values.
- Returns:
- rsqfloat
The r squared value of the fit.
- SSEfloat
The error sum of squares.
- SSTfloat
The total sum of squares.
- SSRfloat
The regression sum of squares.
- get_period(data, sampleRate, pathToPlotFile)
Returns the period and uncertainty for data resembling a decaying oscillation.
- Parameters:
- datandarray, shape(n,)
A time series that resembles a decaying oscillation.
- sampleRateint
The frequency that data was sampled at.
- pathToPlotFilestring
A path to the file to print the plots.
- Returns:
- Tufloat
The period of oscillation and its uncertainty.
- get_period_from_truncated(data, sampleRate, pathToPlotFile)
- get_period_key(matData, forkIsSplit)
Returns a dictionary key for the period entries.
- Parameters:
- matDatadictionary
The data imported from a pendulum mat file.
- forkIsSplitboolean
True if the fork is broken into a handlebar and fork and false if the fork and handlebar was measured together.
- Returns:
- keystring
A key of the form ‘T[pendulum][part][orientation]’. For example, if it is the frame that was hung as a torsional pendulum at the second orientation angle then the key would be ‘TtB2’.
- get_sample_rate(matData)
Returns the sample rate for the data.
- jac_fitfunc(p, t)
Calculate the Jacobian of a decaying oscillation function.
Uses the analytical formulations of the partial derivatives.
- Parameters:
- pthe five parameters of the equation
- ttime vector
- Returns:
- jacThe jacobian, the partial of the vector function with respect to the
- parameters vector. A 5 x N matrix where N is the number of time steps.
- make_guess(data, sampleRate)
Returns a decent starting point for fitting the decaying oscillation function.
- plot_osfit(t, ym, yf, p, rsq, T, m=None, fig=None)
Plot fitted data over the measured
- Parameters:
- tndarray (n,)
Measurement time in seconds
- ymndarray (n,)
The measured voltage
- yfndarray (n,)
- pndarray (5,)
The fit parameters for the decaying osicallation fucntion
- rsqfloat
The r squared value of y (the fit)
- Tfloat
The period
- mfloat
The maximum value to plot
- Returns:
- figthe figure
- select_good_data(data, percent)
Returns a slice of the data from the index at maximum value to the index at a percent of the maximum value.
- Parameters:
- datandarray, shape(1,)
This should be a decaying function.
- percentfloat
The percent of the maximum to clip.
- This basically snips of the beginning and end of the data so that the super
- damped tails are gone and also any weirdness at the beginning.
plot Module
- compare_bode_bicycles(bikes, speed, u, y, fig=None)
Returns a figure with the Bode plots of multiple bicycles.
- Parameters:
- bikeslist
A list of bicycleparameters.Bicycle instances.
- speedfloat
The speed at which to evaluate the system.
- uinteger
An integer between 0 and 1 corresponding to the inputs roll torque and steer torque.
- yinteger
An integer between 0 and 3 corresponding to the inputs roll rate, steer rate, roll angle and steer angle.
- Returns:
- figmatplotlib.Figure instance
The Bode plot.
Notes
The phases are matched around zero degrees at with respect to the first frequency.
- plot_eigenvalues(bikes, speeds, colors=None, linestyles=None, largest=False, show=False)
Returns a figure with the eigenvalues vs speed for multiple bicycles.
- Parameters:
- bikeslist
A list of Bicycle objects.
- speedsndarray, shape(n,)
An array of speeds.
- colorslist
A list of matplotlib colors for each bicycle.
- linestyleslist
A list of matplotlib linestyles for each bicycle.
- largestboolean
If true, only plots the largest eigenvalue.
- Returns:
- figmatplotlib figure
rider Module
- configure_rider(pathToRider, bicycle, bicyclePar, measuredPar, draw)
Returns the rider parameters, bicycle paramaters with a rider and a human object that is configured to sit on the bicycle.
- Parameters:
- pathToRiderstring
Path to the rider’s data folder.
- bicyclestring
The short name of the bicycle.
- bicyclePardictionary
Contains the benchmark bicycle parameters for a bicycle.
- measuredPardictionary
Contains the measured values of the bicycle.
- drawboolean, optional
If true, visual python will be used to draw a three dimensional image of the rider.
- Returns:
- riderpardictionary
The inertial parameters of the rider with reference to the benchmark coordinate system.
- humanyeadon.human
The human object that represents the rider seated on the bicycle.
- bicycleRiderPardictionary
The benchmark parameters of the bicycle with the rider added to the rear frame.
- rider_on_bike(benchmarkPar, measuredPar, yeadonMeas, yeadonCFG, drawrider)
Returns a yeadon human configured to sit on a bicycle.
- Parameters:
- benchmarkPardictionary
A dictionary containing the benchmark bicycle parameters.
- measuredPardictionary
A dictionary containing the raw geometric measurements of the bicycle.
- yeadonMeasstr
Path to a text file that holds the 95 yeadon measurements. See yeadon documentation.
- yeadonCFGstr
Path to a text file that holds configuration variables. See yeadon documentation. As of now, only ‘somersalt’ angle can be set as an input. The remaining variables are either zero or calculated in this method.
- drawriderbool
Switch to draw the rider, with vectors pointing to the desired position of the hands and feet of the rider (at the handles and bottom bracket). Requires python-visual.
- Returns:
- humanyeadon.Human
Human object is returned with an updated configuration. The dictionary, taken from H.CFG, has the following key’s values updated:
‘PJ1extension’ ‘J1J2flexion’ ‘CA1extension’ ‘CA1adduction’ ‘CA1rotation’ ‘A1A2extension’ ‘somersault’ ‘PK1extension’ ‘K1K2flexion’ ‘CB1extension’ ‘CB1abduction’ ‘CB1rotation’ ‘B1B2extension’
Notes
Requires that the bike object has a raw data text input file that contains the measurements necessary to situate a rider on the bike (i.e.
<pathToData>/bicycles/<short name>/RawData/<short name>Measurements.txt).
- yeadon_vec_to_bicycle_vec(vector, measured_bicycle_par, benchmark_bicycle_par)
- Parameters:
- vectorndarray, shape(3, 1)
A vector from the Yeadon origin to a point expressed in the Yeadon reference frame.
- measured_bicycle_pardictionary
The raw bicycle measurements.
- benchmark_bicycle_pardictionary
The Meijaard 2007 et. al parameters for this bicycle.
- Returns:
- vector_wrt_bikendarray, shape(3, 1)
The vector from the bicycle origin to the same point above expressed in the bicycle reference frame.
tables Module
- class Table(source, latex, bicycles)
Bases:
objectA class for generating tables of the measurment and parameter data associated with a bicycle.
- create_rst_table(fileName=None)
Returns a reStructuredText version of the table.
- Parameters:
- fileNamestring
If a path to a file is given, the table will be written to that file.
- Returns:
- rstTablestring
reStructuredText version of the table.
- generate_table_data()
Generates a list of data for a table.
- generate_variable_list()
- to_latex(var)
Returns a latex representation for a given variable string name.
- Parameters:
- varstring
One of the variable names used in the bicycleparameters package.
- Returns:
- latexstring
A string formatting for pretty LaTeX math print.
- uround(value)
Returns a string representation of a value with an uncertainity which has been rounded to significant digits based on the uncertainty value.
- Parameters:
- valueufloat
A single ufloat.
- Returns:
- sstring
A rounded string representation of value.
- 2.4563752289999+/-0.0003797273827
- becomes
- 2.4564+/-0.0004
- This probably doesn’t work for weird cases like large uncertainties.